Reports
AutoRunner Reports contains Plan Report, Trends, and Compare Runs. Reports summarize persisted Test Runs; they do not include AI generation as a substitute for plan execution.
Plan Report
Filter by project, Test Plan, date range, status, and result. Select a project and plan with persisted runs to populate its quality metrics, chart, and run rows.
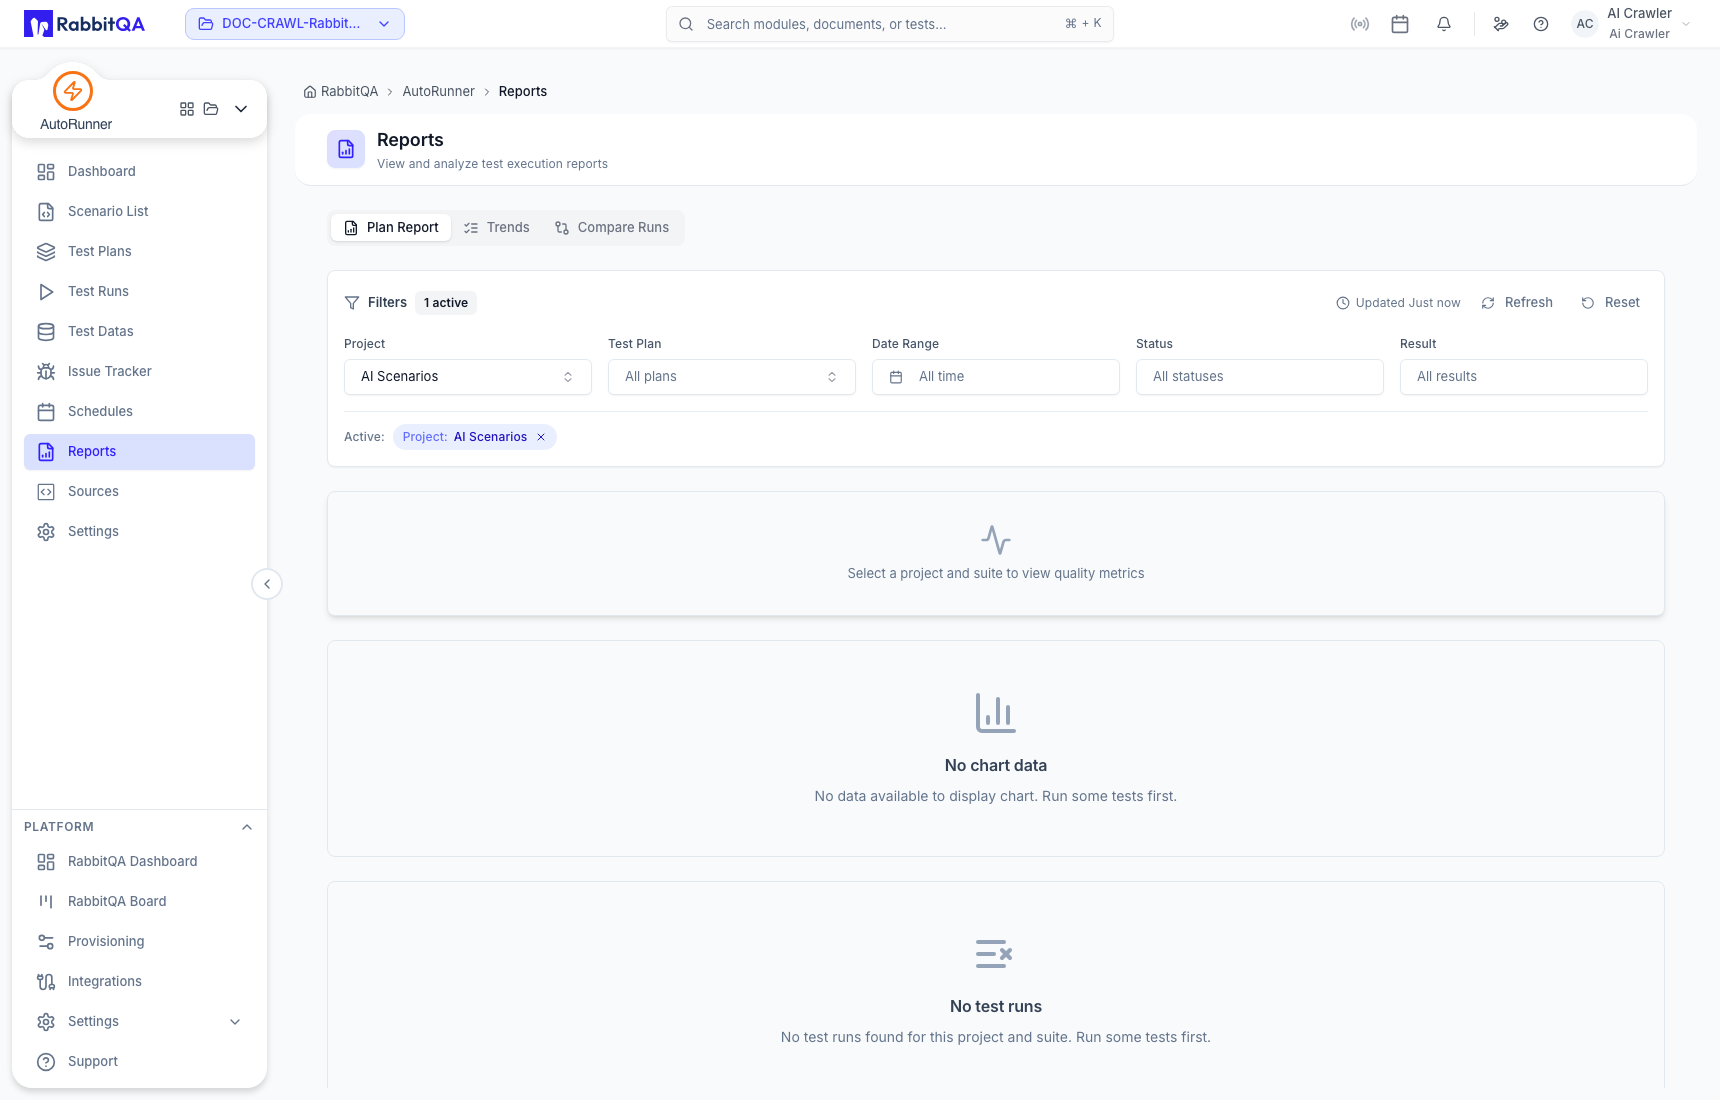
An empty report usually means the selected scope has no matching Test Runs. Verify the project, plan, date range, status, and result before concluding that no automation exists.
Trends
Trends visualize pass rate and result distribution across the selected number of recent runs.
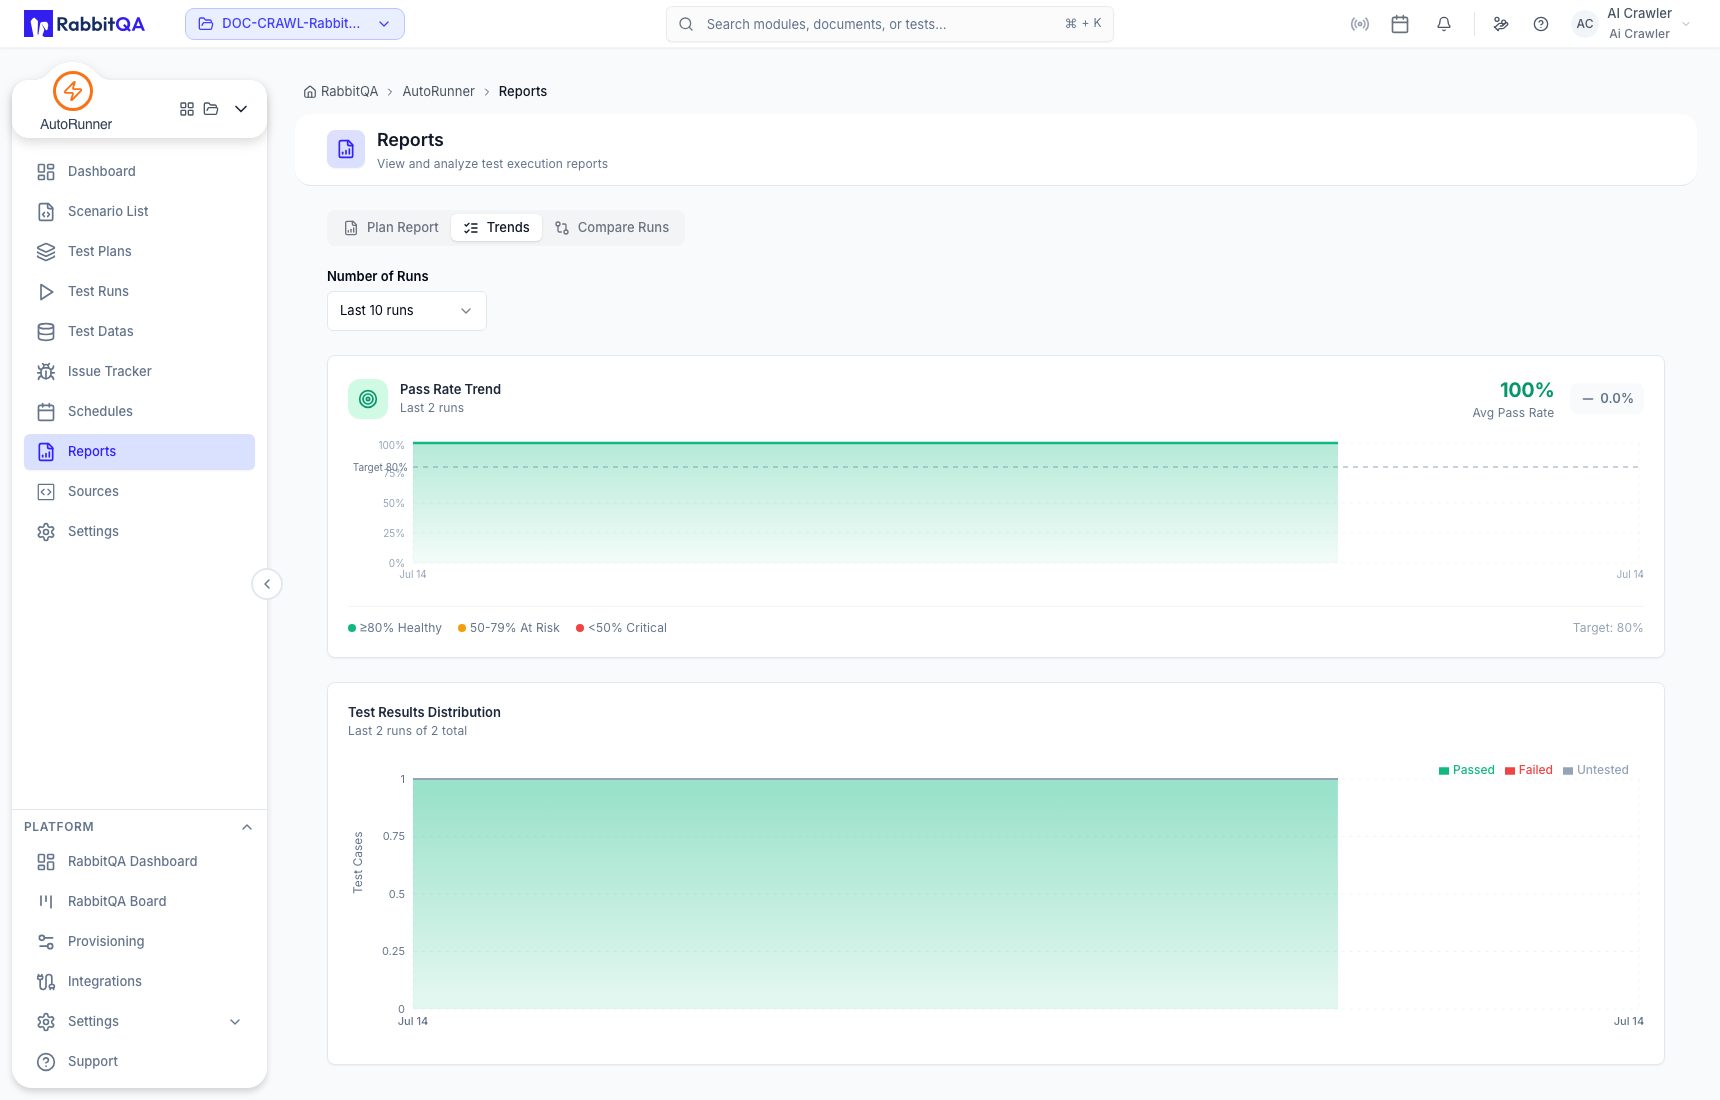
Use the persisted run table beneath the charts to identify which executions produced the trend. Open the run before classifying a regression.
Compare Runs
Choose a project, plan, and Test Run independently for the first and second side, then inspect scenario-level differences and pass-rate changes.
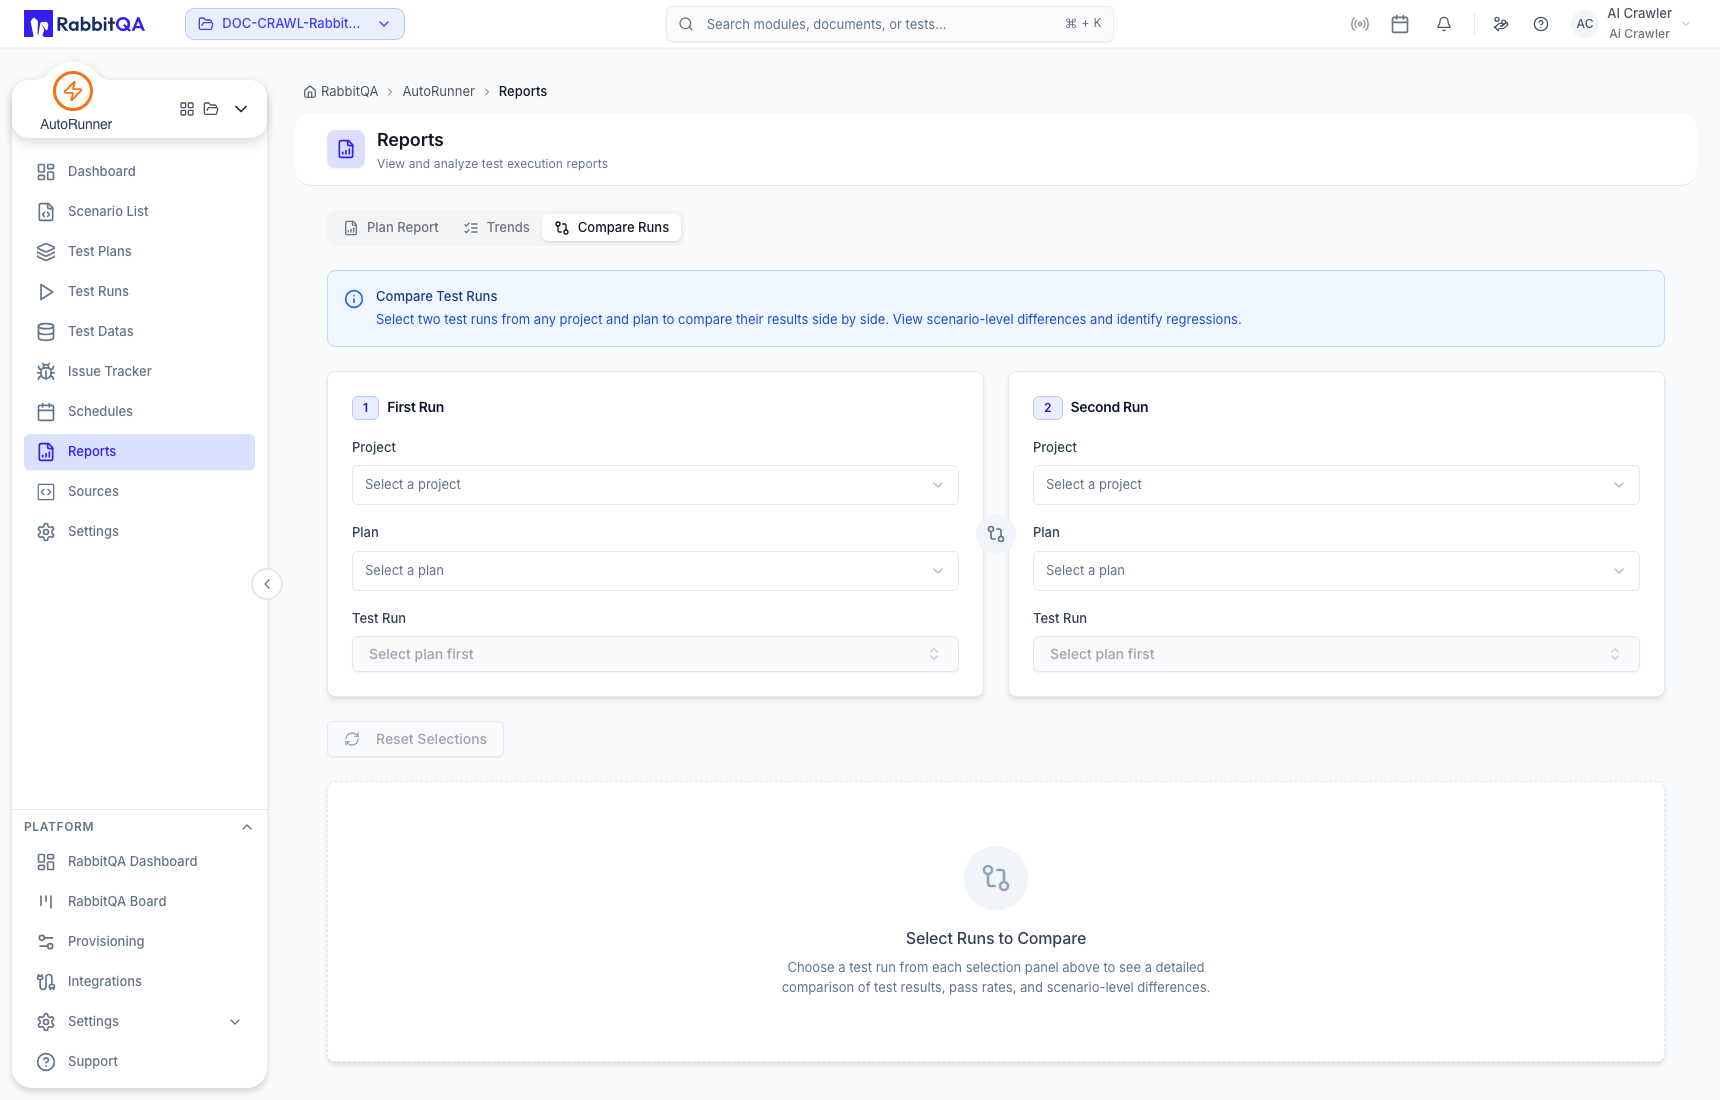
Compare like with like: environment, Run Profile, source revision, runner, test data, and scenario order can all explain a difference.
Quality gates and exports
AutoRunner exposes quality-gate values and pass/fail evaluation in current settings and reporting services. Treat that result as informational unless your external pipeline explicitly reads and enforces it. The current verified source does not show a generic gate automatically blocking a merge, deployment, or run.
Run reporting and CSV-oriented endpoints exist, but generic export and scheduled-report scaffolding is not complete across every view. Use only export actions shown and verified in your deployment.
Charts are a navigation aid. Release decisions should reference the exact Test Runs, their evidence, and the approved quality policy.
