Dashboard
The Dashboard is AutoRunner's operational overview. It summarizes the active workspace and selected time window without replacing run-level investigation.
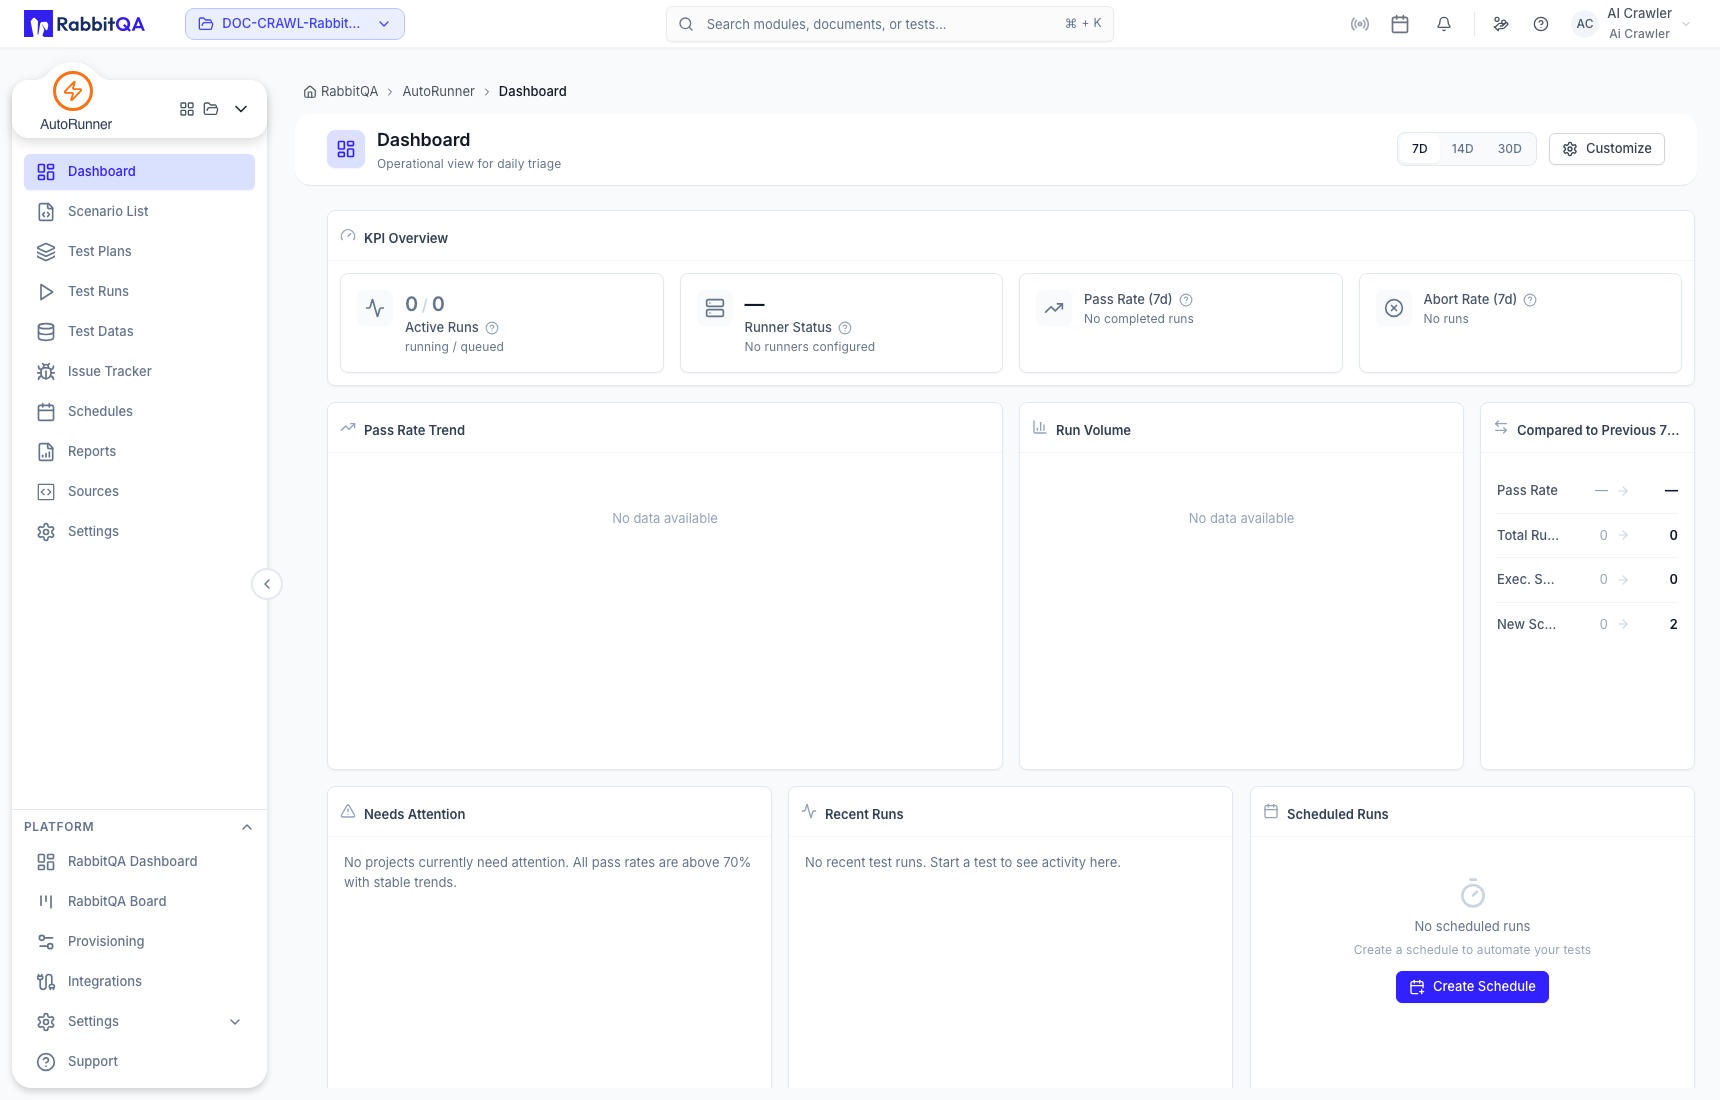
Time window and KPI overview
Use 7D, 14D, or 30D to change the reporting period. The KPI area can show:
- active runs, split into running and queued;
- runner status;
- pass rate for the selected period; and
- abort rate for the selected period.
An empty value means that the current workspace and time range do not provide the required data. It does not prove that a service or runner is healthy.
Dashboard widgets
Current widgets include KPI Overview, Period Comparison, Pass Rate Trend, Run Volume, Recent Runs, Scheduled Runs, and Needs Attention.
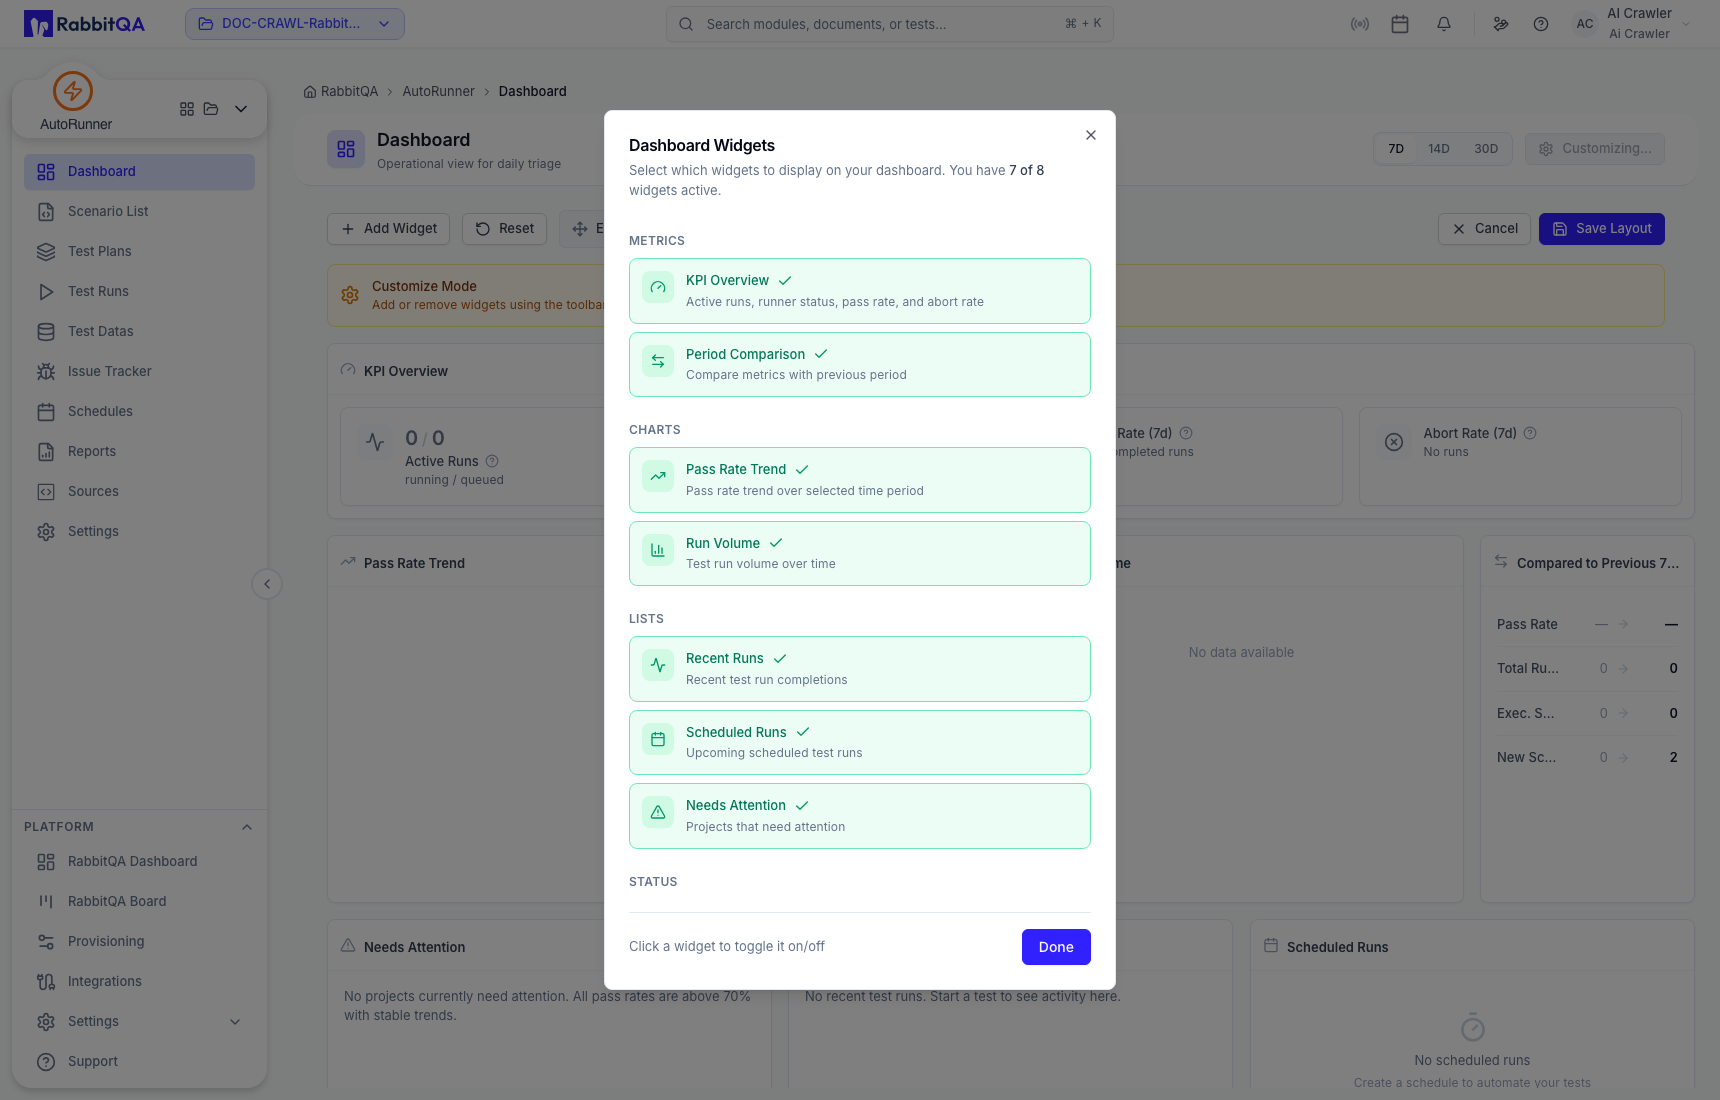
Select Customize to add or remove widgets. Enable Edit Mode to drag or resize them, then use Save Layout. Reset returns the layout to its default arrangement.
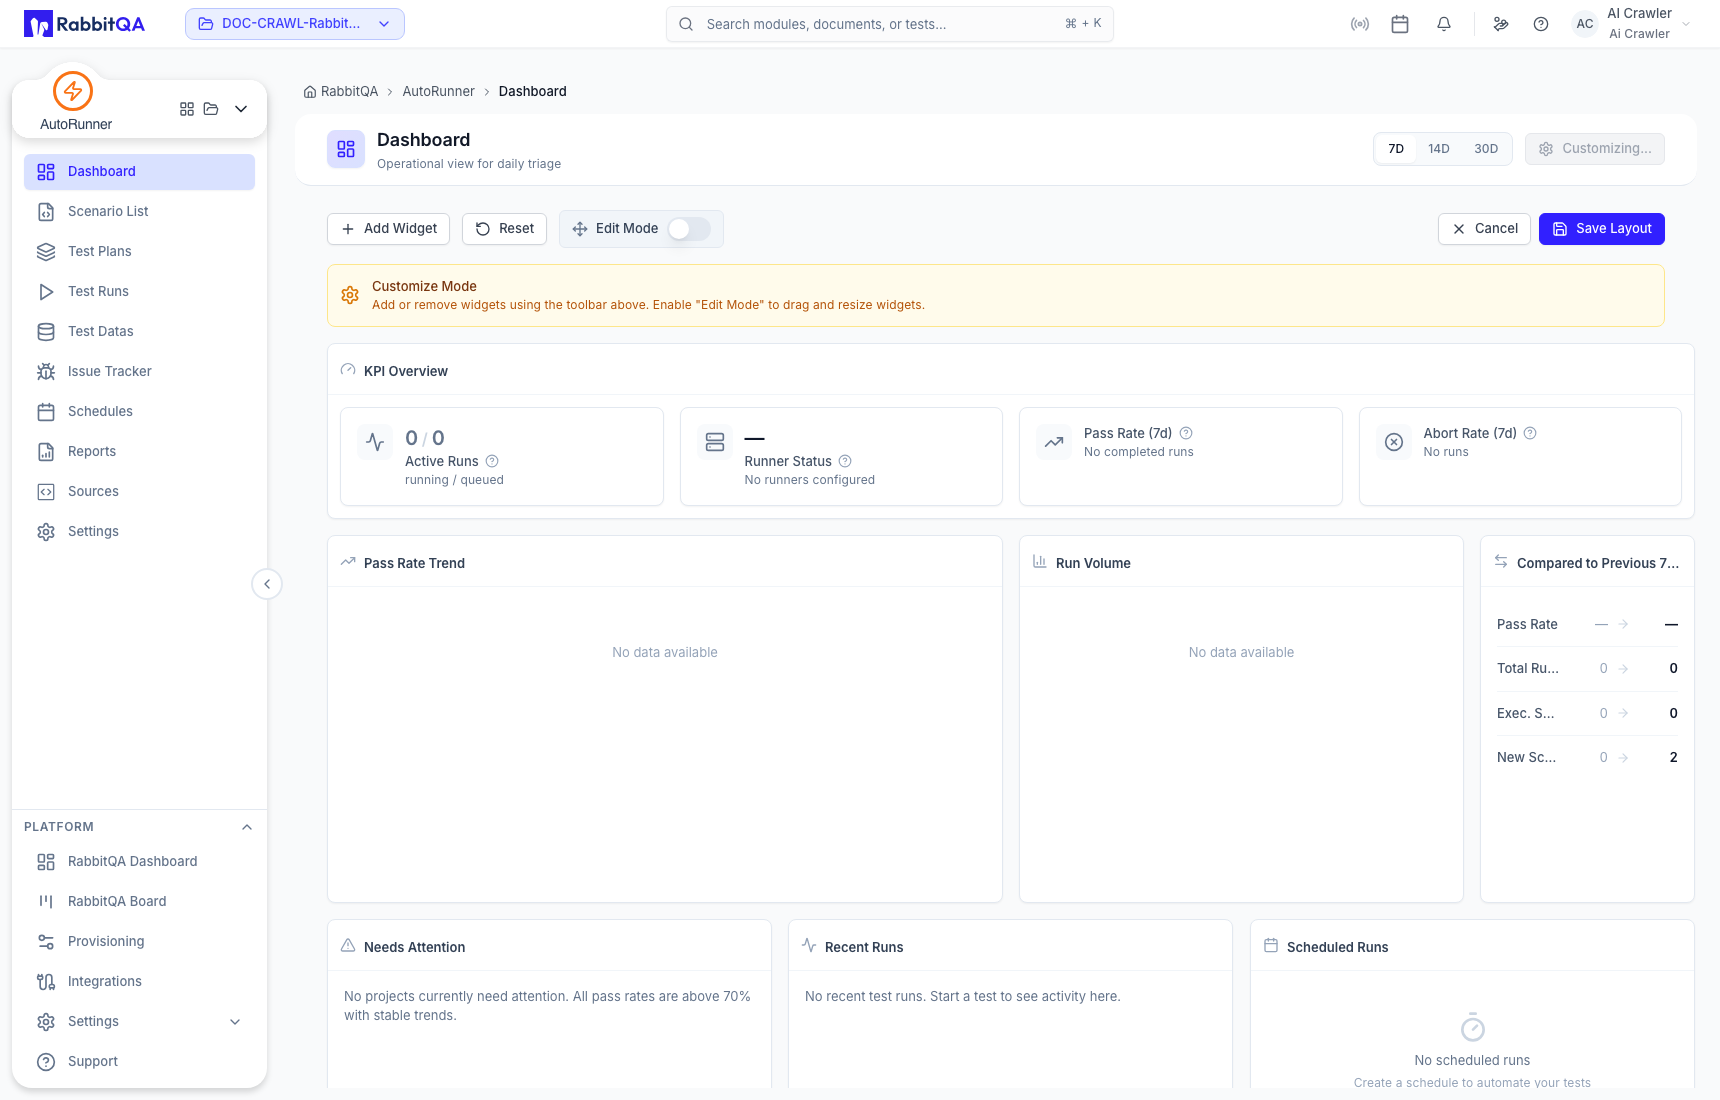
Reading the dashboard safely
- Use Needs Attention to prioritize investigation, not as the only quality signal.
- Open Recent Runs before acting on a trend; the underlying run contains the actual evidence.
- Treat Scheduled Runs as upcoming configuration, not confirmation that execution will succeed.
- Verify the active workspace and reporting period before comparing metrics.
- A newly generated scenario can change scenario totals without producing a plan Test Run.
