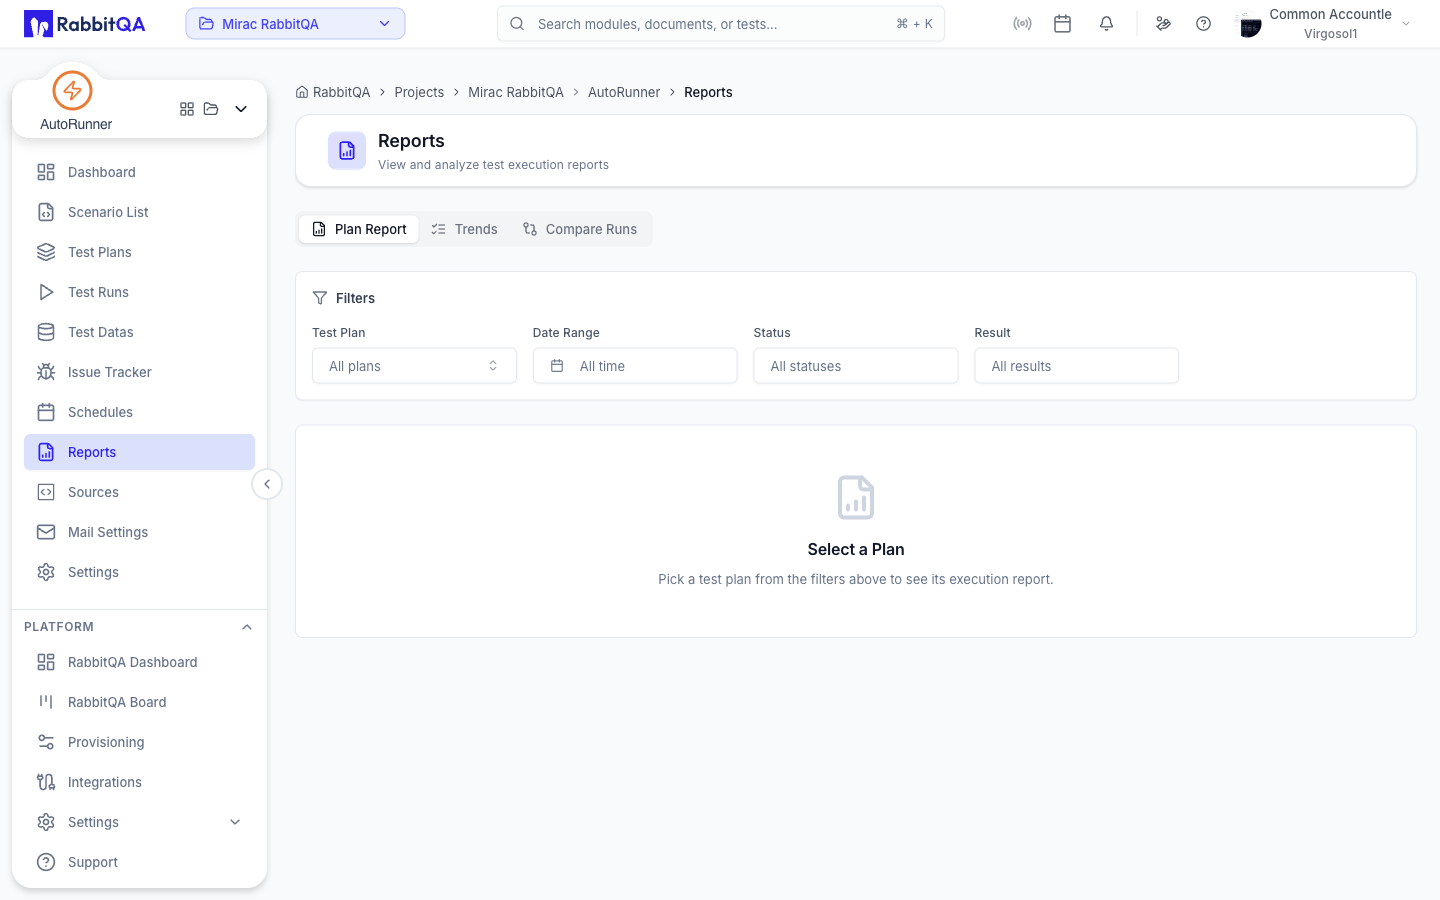
Reports
Analyze test run results, identify failure patterns, track long-term trends, and export detailed reports for stakeholders.
What are AutoRunner Reports?
AutoRunner Reports provide detailed analysis of your test execution data. Generate reports at the run, suite, or project level to understand pass rates, failure patterns, performance trends, and overall test health. Export reports in multiple formats for sharing with stakeholders and compliance documentation.
Run Reports
Each completed test run generates a detailed report accessible from the run detail page.
Run Summary
| Metric | Description |
|---|---|
| Pass Rate | Percentage of scenarios that passed |
| Total Scenarios | Number of scenarios executed |
| Passed | Count of successful scenarios |
| Failed | Count of failed scenarios |
| Skipped | Count of skipped scenarios |
| Duration | Total execution time |
| Driver | Browser or device driver used |
| Environment | Target environment for the run |
Scenario Breakdown
A table listing every scenario with its individual result:
| Column | Description |
|---|---|
| Scenario Name | Name of the Gherkin scenario |
| Status | Passed, Failed, or Skipped |
| Duration | Execution time for the scenario |
| Steps | Pass/fail count per step |
| Error | Error message (for failed scenarios) |
Click any scenario row to expand step-by-step details, screenshots, and logs.
Suite Reports
Suite-level reports aggregate results across multiple runs for a single test suite.
Suite Health Metrics
| Metric | Description |
|---|---|
| Average Pass Rate | Mean pass rate across all runs in the selected period |
| Run Count | Total number of runs executed |
| Failure Rate | Percentage of runs with at least one failure |
| Avg. Duration | Average execution time per run |
| Flaky Scenarios | Scenarios that intermittently pass and fail |
Pass Rate Over Time
A line chart showing the suite's pass rate trend across runs. Use this to identify:
- Gradual quality improvements or degradation
- Sudden drops caused by code changes
- Stabilization after fixes
Trend Analysis
Trend analysis provides project-wide and cross-project insights over time.
Available Trend Views
| View | Description |
|---|---|
| Pass Rate Trend | Pass rate progression across days, weeks, or months |
| Run Volume Trend | Number of runs executed per period |
| Duration Trend | Average run duration changes over time |
| Failure Density | Number of unique failures per period |
Filtering Trends
Filter trend data by:
- Time Range — Last 7 days, 30 days, 90 days, or custom range
- Project — Single project or all projects
- Suite — Specific suite or all suites
- Framework — Filter by test framework
- Driver — Filter by browser or device
Failure Analysis
The failure analysis section helps you identify and resolve recurring test failures.
Top Failures
A ranked list of the most frequently failing scenarios across runs:
| Column | Description |
|---|---|
| Scenario | Scenario name and feature file |
| Failure Count | Number of times the scenario failed |
| Last Failed | Date of the most recent failure |
| Error Pattern | Most common error message |
| Suite | Associated test suite |
Flaky Test Detection
AutoRunner identifies flaky tests — scenarios that alternate between pass and fail across consecutive runs:
- Flakiness Score — Percentage of inconsistent results (higher = flakier)
- Run History — Visual pass/fail pattern across recent runs
- Recommendation — Suggested action (stabilize, quarantine, or investigate)
Flaky tests erode confidence in your test suite. Address scenarios with a flakiness score above 20% by reviewing test isolation, timing dependencies, and external service mocks.
Export Options
Export reports in multiple formats:
| Format | Description | Use Case |
|---|---|---|
| Formatted report document | Stakeholder sharing, print | |
| CSV | Raw data in spreadsheet format | Data analysis, custom reporting |
| JSON | Structured data for programmatic use | Integration with other tools |
Exporting a Report
- Navigate to the report you want to export (run, suite, or trend).
- Click the Export button in the toolbar.
- Select the desired format.
- The file downloads to your browser.
Combine scheduled test runs with notification webhooks to automatically deliver reports to your team after each execution.
Metrics Breakdown
Detailed performance metrics available in reports:
| Metric | Level | Description |
|---|---|---|
| Pass Rate | Run, Suite, Project | Percentage of passed scenarios |
| Execution Duration | Run, Scenario, Step | Time taken at each level |
| Failure Rate | Suite, Project | Percentage of failing runs |
| Flakiness Score | Scenario | Inconsistency measurement |
| Step Duration | Step | Individual step timing |
| Retry Count | Scenario | Number of retry attempts |
| Screenshot Count | Run | Total captured screenshots |
Next Steps
- Dashboard — View high-level metrics and KPI summaries
- Test Runner — Drill into individual run results
- Scheduling — Set up recurring runs for consistent trend data
