Reports
Reports analyze test execution across many runs, rather than one run at a time.
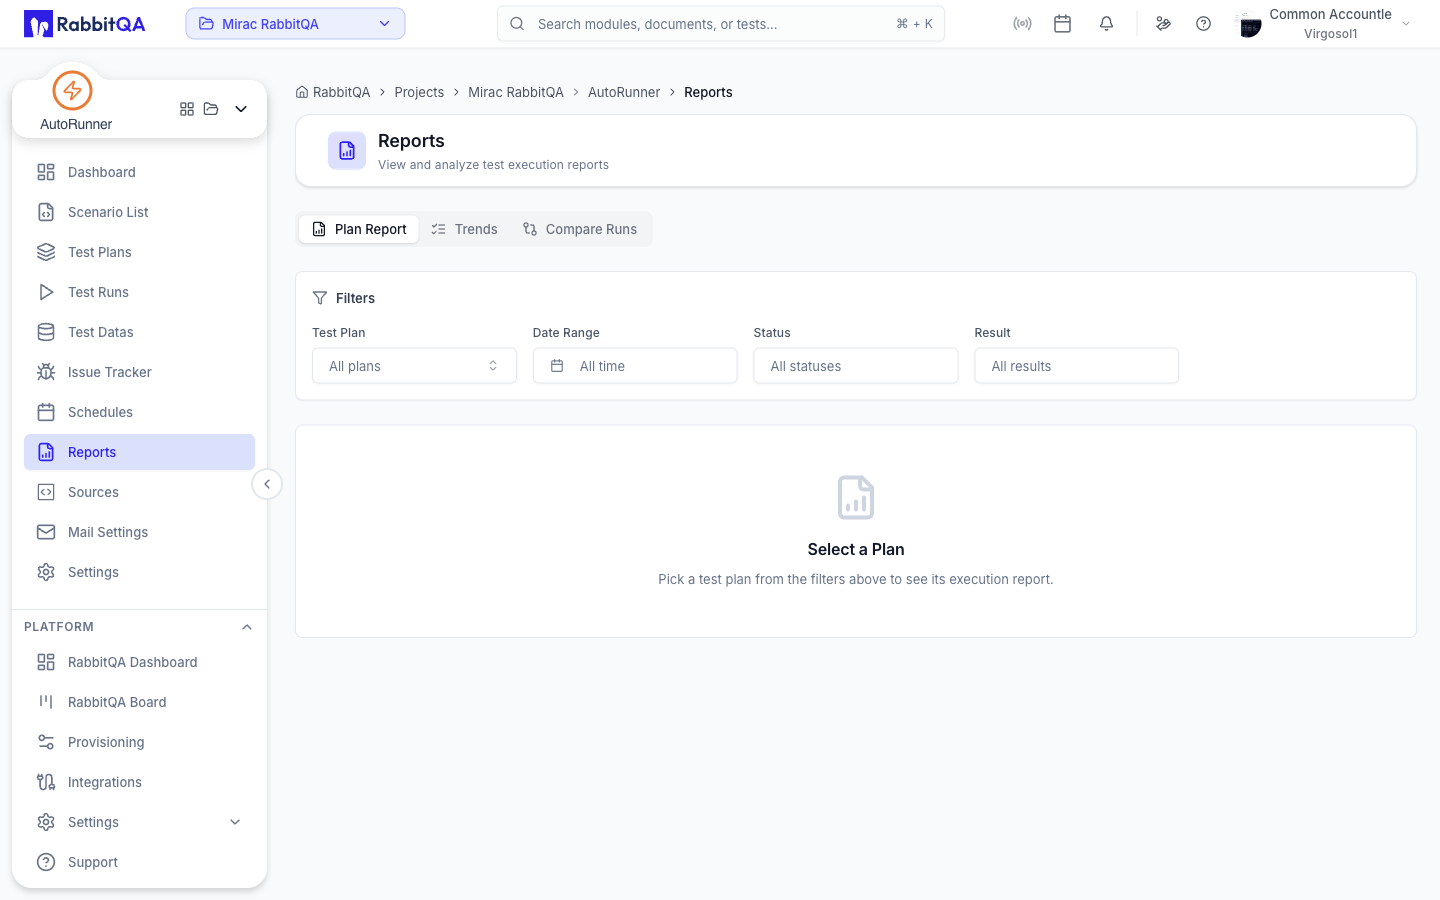
The page has three tabs: Plan Report, Trends, and Compare Runs.
Plan Report
Start by picking a test plan, then narrow the runs with the Filters bar.
| Filter | Options |
|---|---|
| Test Plan | The plan to report on. Searchable. |
| Date Range | Today, Last 7 days, Last 30 days, Last 90 days, All time |
| Status | Waiting, Pending, Running, Finished, Aborted |
| Result | Success, Failure, Error, Partial |
| Tags | Scenario tags |
The report then shows:
- A quality gate card with the plan's pass-rate standing.
- A trend chart across the filtered runs.
- A run selector for choosing which runs to analyze in depth.
- Detailed analysis — a comparison chart and a scenario comparison — once runs are selected.
You can select up to 10 runs at a time.
If no runs match, use Clear Filters to widen the range.
Trends
Track the plan over its recent history.
Choose how far back to look — Last 10 runs, Last 25 runs, or Last 50 runs — and the tab draws a trend chart with the underlying runs in a table beneath it. Each table row offers Compare, which carries that run into the comparison view.
Compare Runs
Put runs side by side to see what changed between them.
Use it to confirm a fix by comparing a failing run with the re-run after it, or to check whether a difference is environmental by comparing the same plan across two environments.
Exporting
Both exports are available on the Plan Report tab once a plan is selected and runs are present.
Export CSV
Downloads the filtered run data as a spreadsheet.
Download PDF
PDF Export Options lets you choose what the file contains, with Select All as a shortcut:
| Section | Requires selected runs |
|---|---|
| Plan Summary Statistics | No |
| Quality Gate Status | No |
| Execution Trends Chart | No |
| Selected Test Runs Table | Yes |
| Selected Runs Statistics | Yes |
| Comparison Chart | Yes |
| Scenario Comparison Table | Yes |
For a single run rather than a trend, use View Report on the run itself. See Run Detail.
Next Steps
- Dashboard — The short-range triage view
- Test Runs — The runs behind these numbers
- Run Detail — A per-run report with screenshots
- Settings — Set the quality gate threshold these reports measure against
