Dashboard
Monitor your test automation health through a customizable dashboard with real-time KPIs, trend charts, and activity feeds.
What is the AutoRunner Dashboard?
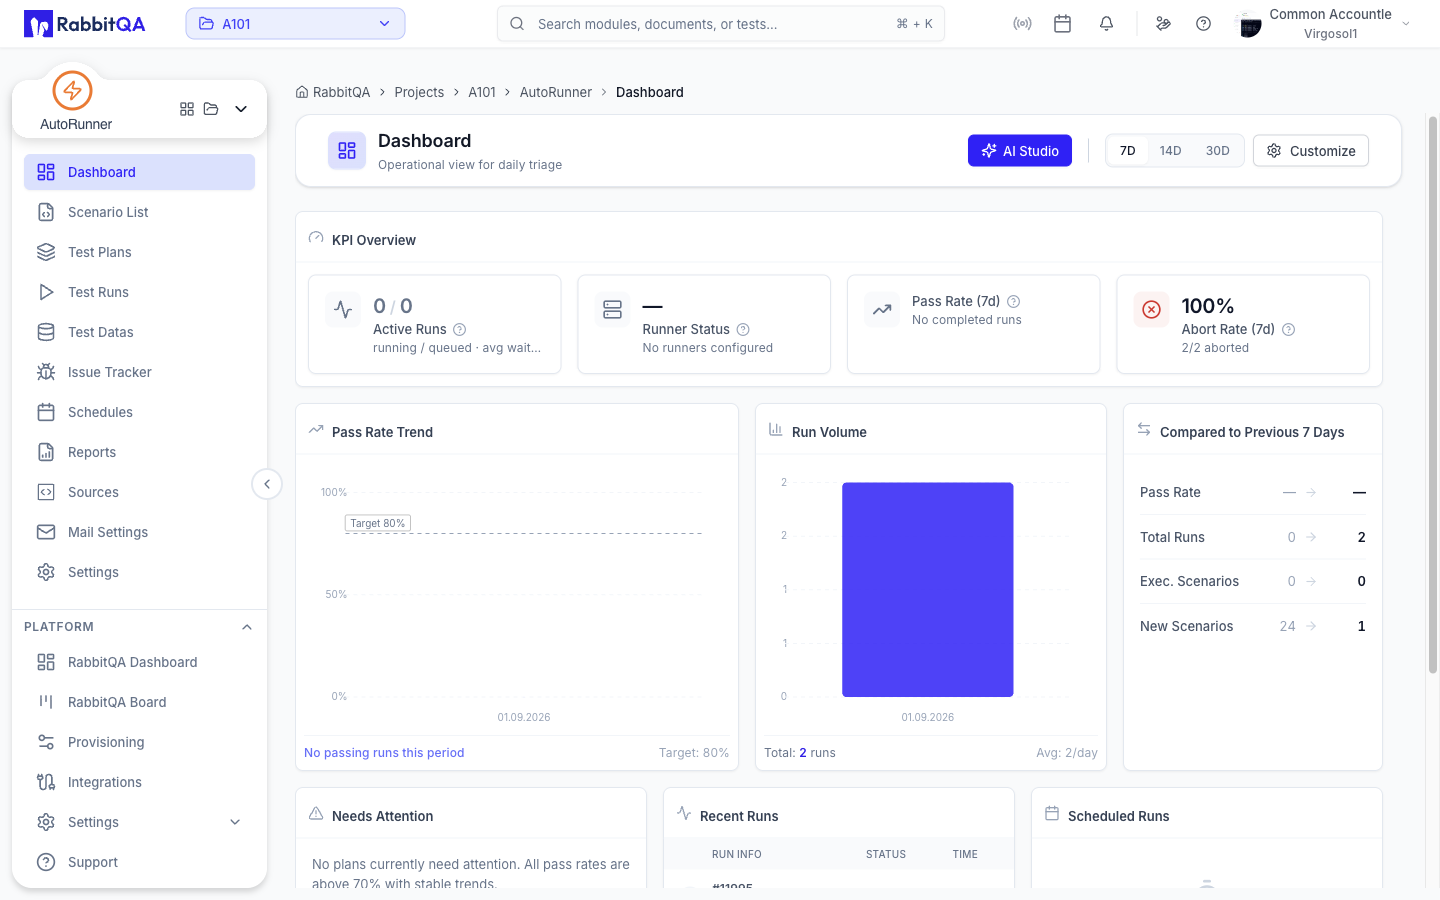
The AutoRunner Dashboard provides a centralized view of your test automation performance. It displays key metrics, trend visualizations, and actionable alerts — all in a customizable layout that you can tailor to your team's needs.
Dashboard Layout
The dashboard uses a drag-and-drop layout manager that allows you to rearrange, resize, and customize widgets. Each team member can configure their own dashboard layout.
To customize the layout:
- Click the Customize button in the upper-right corner.
- Drag widgets to rearrange their position.
- Resize widgets by dragging their edges.
- Click Save Layout to persist your changes.
Click Reset to Default in the customize panel to restore the standard dashboard layout.
KPI Row
The KPI row displays high-level metrics across your automation projects:
| KPI | Description |
|---|---|
| Overall Pass Rate | Percentage of passed scenarios across all projects |
| Total Runs | Number of test runs executed in the selected time range |
| Active Projects | Count of projects with recent activity |
| Failed Suites | Number of suites with failing tests requiring attention |
| Avg. Duration | Average execution time across all runs |
Time Range Selector
Filter all dashboard data by selecting a time range:
- Last 24 Hours — Recent activity snapshot
- Last 7 Days — Weekly trend view (default)
- Last 30 Days — Monthly performance overview
- Custom Range — Select specific start and end dates
Charts & Visualizations
Pass Rate Trend Chart
Displays the pass rate percentage over time as a line chart. Use this to identify trends in test stability.
- Green zone: Pass rate above 90%
- Yellow zone: Pass rate between 70–90%
- Red zone: Pass rate below 70%
Run Volume Chart
Bar chart showing the number of test runs executed per day, week, or month. Helps you track testing cadence and workload distribution.
Needs Attention List
The Needs Attention section highlights suites and projects that require immediate action:
- Suites with consecutive failures
- Runs stuck in PENDING or QUEUED status
- Schedules that missed their execution window
- Projects with declining pass rates
Click any item to navigate directly to the affected suite or run.
Items in the Needs Attention list indicate potential quality risks. Address failing suites promptly to prevent regression debt.
Recent Activity Feed
A chronological feed of recent events across all projects:
- Test run completions (pass/fail)
- New project or suite creation
- Schedule activations and completions
- Configuration changes
Scheduled Timeline
Visual timeline showing upcoming scheduled test runs. Each entry displays:
- Schedule name and associated suite
- Next execution time
- Status indicator (Active, Paused)
Click a schedule entry to view or edit its configuration.
Platform Status Row
The Platform Status row shows the health of underlying infrastructure:
| Status | Description |
|---|---|
| Engine | Test engine container availability |
| Drivers | Browser and device driver readiness |
| Scheduler | Schedule service operational status |
| Queue | Run queue depth and processing rate |
Green indicators confirm all systems are operational. Yellow or red indicators suggest capacity or configuration issues.
Quick Run
The Quick Run dropdown allows you to start a test run directly from the dashboard:
- Click the Quick Run button in the dashboard toolbar.
- Select a project from the dropdown list.
- Choose a suite to execute.
- Click Run Now to start execution immediately.
The run appears in the Recent Activity feed once started.
Next Steps
- Projects — Create and manage automation projects
- Test Runner — Monitor active test runs in detail
- Reports — Generate detailed trend and failure analysis reports
