Dashboard
The Dashboard is AutoRunner's operational view for daily triage. It answers one question: what needs your attention in this workspace right now.
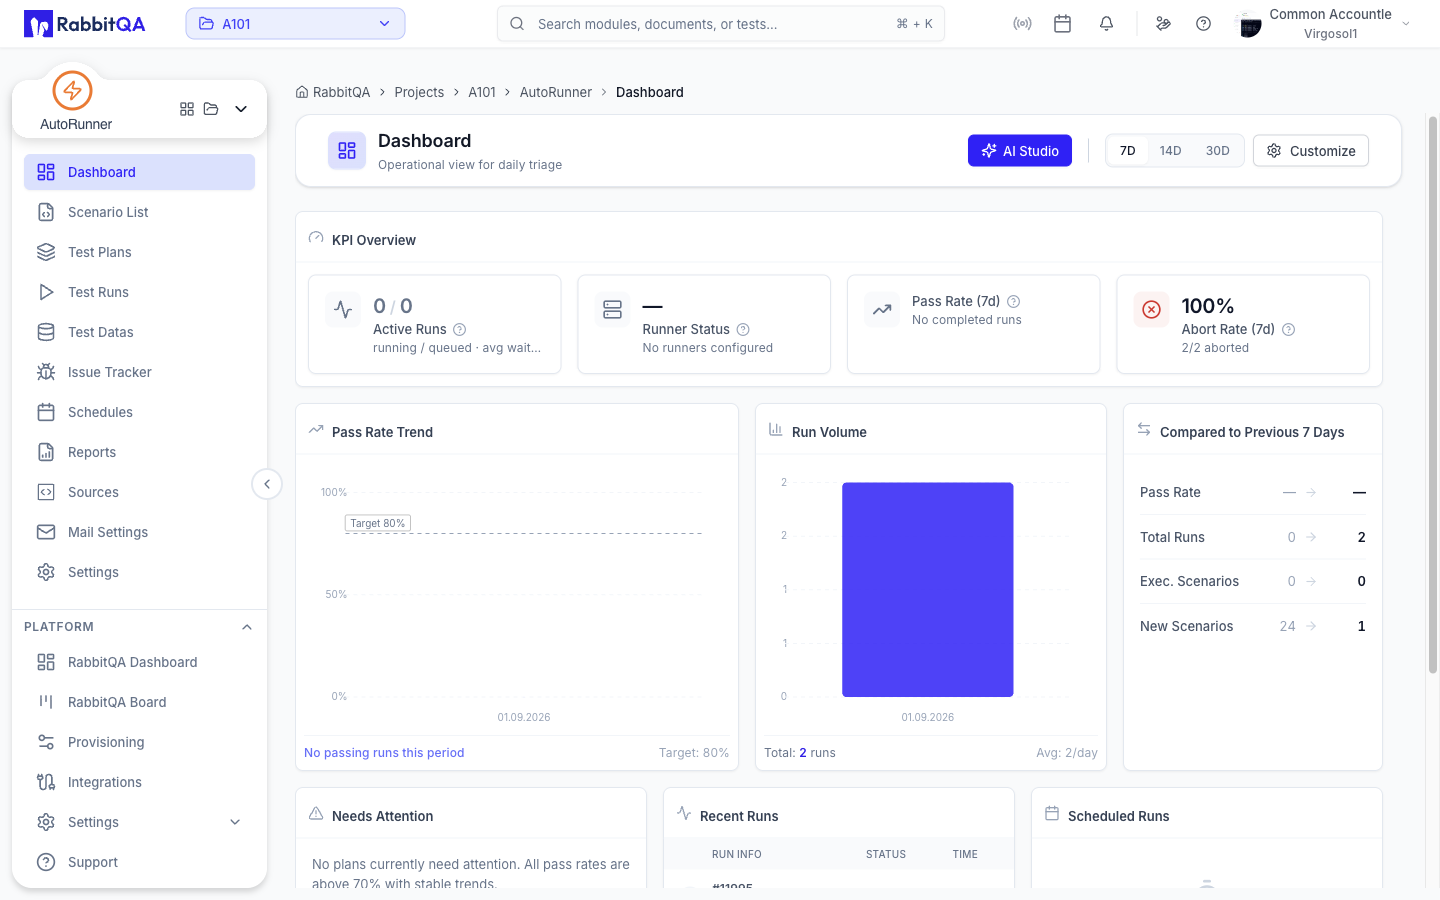
Time Range
The selector in the page header switches the whole dashboard between three windows:
- 7D (default)
- 14D
- 30D
Every trend chart and every KPI labelled with a day count follows this selection.
KPI Overview
| KPI | What it shows |
|---|---|
| Active Runs | Running and queued run counts, average wait, and how many runs are overdue |
| Runner Status | Online runners out of total, with utilization; warns at capacity or high utilization |
| Pass Rate (Nd) | Pass rate for the selected window, with the passed-out-of-completed count |
| Abort Rate (Nd) | Share of runs that were aborted, with a breakdown of abort reasons |
Widgets
The dashboard is a widget grid. These widgets are on by default:
| Widget | Content |
|---|---|
| KPI Overview | The four KPIs above |
| Pass Rate Trend | Pass rate over the selected time period |
| Run Volume | Test run volume over time |
| Compared to Previous N Days | Pass Rate, Total Runs, Exec. Scenarios, and New Scenarios against the previous period |
| Needs Attention | Plans whose results are degrading |
| Recent Runs | Recently completed runs with status and time |
| Scheduled Runs | Upcoming scheduled runs |
One more widget is available but not shown until you add it:
| Widget | Content |
|---|---|
| Platform Status | Tonight, Overdue, Needs Attention, and Setup Gaps counters, or "All systems operational" |
Needs Attention
The Needs Attention list is the triage entry point. Each row shows the Plan, its pass Rate, and the Reason it was flagged.
Row actions:
- Run now — opens the runs list for that plan and starts a run.
- Open report — opens Reports filtered to that plan's source.
Selecting the row itself opens Test Runs filtered to the plan.
When nothing is degrading, the widget shows All Plans Healthy.
Customizing the Layout
Select Customize in the page header.
- Add Widget opens the widget picker, grouped into Metrics, Charts, Lists, and Status. Select a widget to toggle it on or off, then Done.
- Turn on Edit Mode to drag widgets into place and resize them by their corners.
- Save Layout stores the arrangement, Cancel discards it, and Reset restores the default layout.
Your layout is saved to your account, so it follows you between browsers.
Drag-and-drop arrangement needs a wide screen. On narrow screens the widgets stack in a single column and cannot be repositioned.
Next Steps
- Test Runs — The full run history behind these numbers
- Test Plans — Fix the plans flagged in Needs Attention
- Schedules — Adjust the runs listed under Scheduled Runs
- Reports — Longer-range trend and result analysis
