Dashboard
The Smart PBI Dashboard summarizes the selected project's backlog-generation activity. Always confirm the project selector before interpreting totals or opening a recent session.
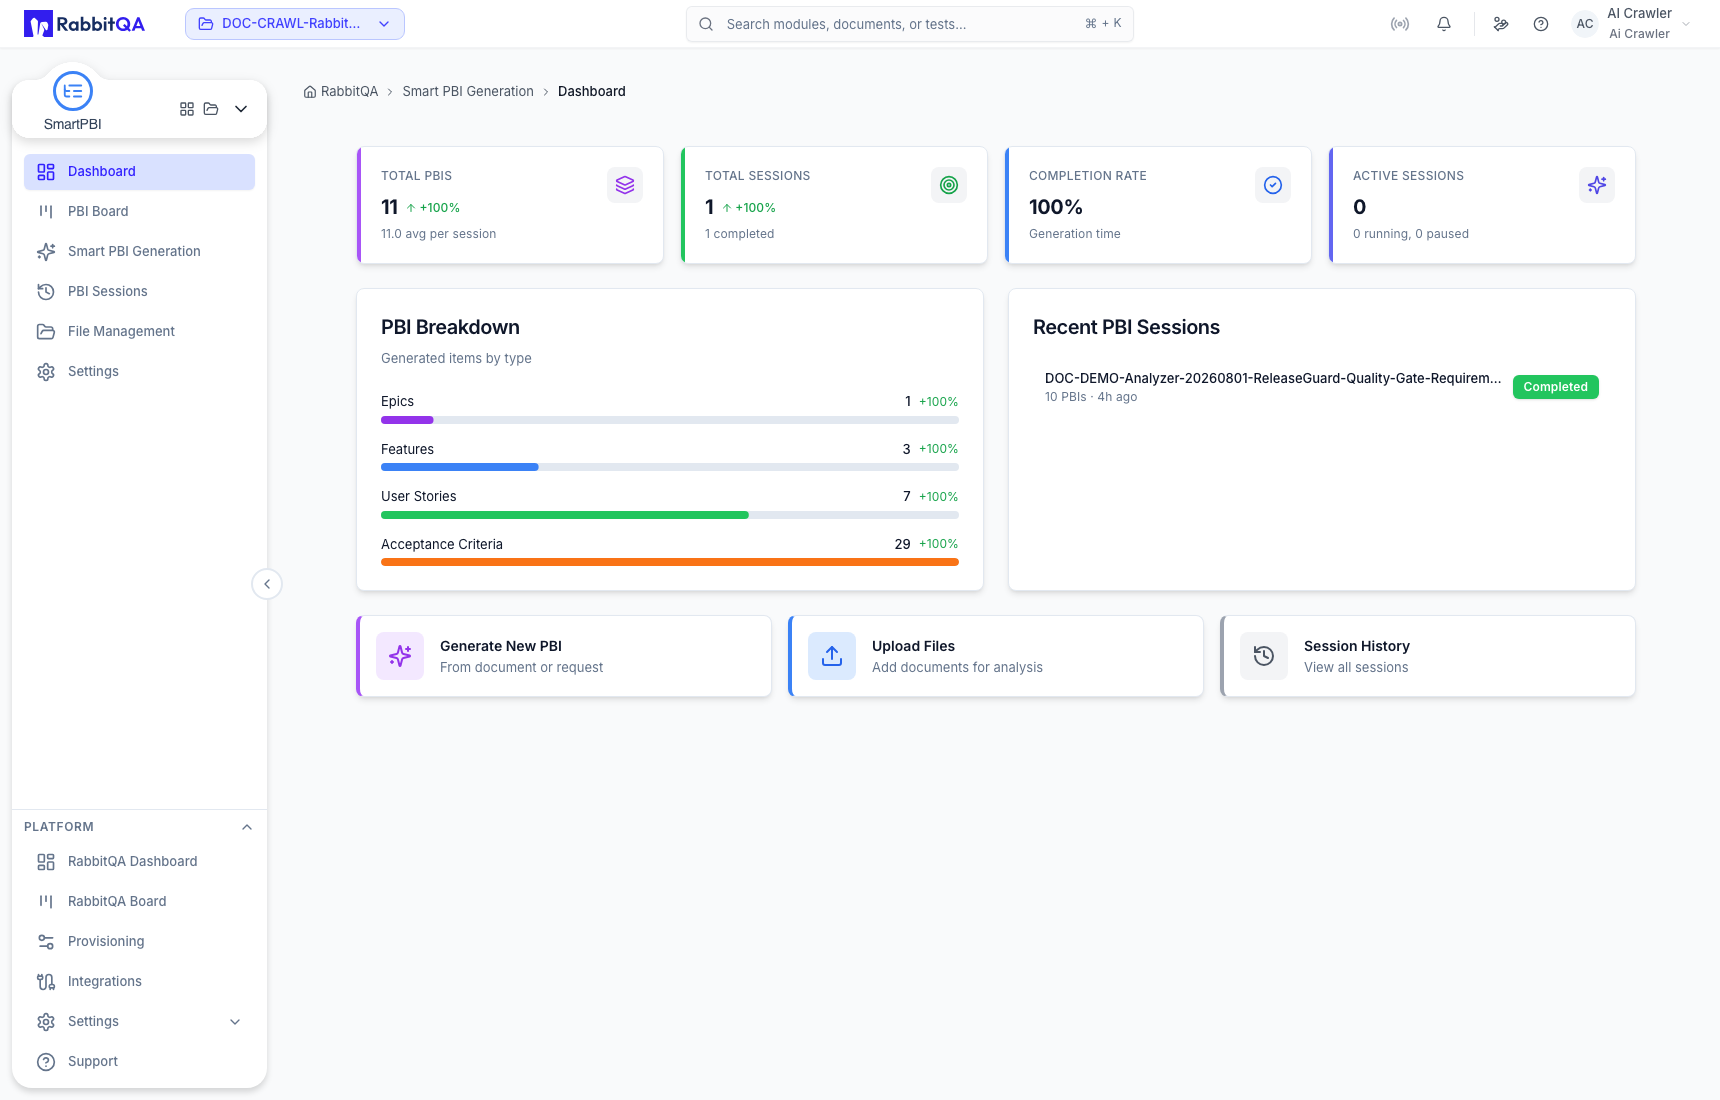
Summary cards
| Card | What it represents |
|---|---|
| Total PBIs | Generated Product Backlog Items counted for the selected project. |
| Total Sessions | Saved PBI generation sessions for the selected project. |
| Completion Rate | The share of sessions that reached completion. |
| Active Sessions | Sessions that are currently active rather than completed or terminal. |
These values summarize saved Smart PBI activity. They are not delivery progress, test coverage, or proof that generated items were approved.
PBI breakdown
The breakdown separates the generated hierarchy into Epics, Features, User Stories, and Acceptance Criteria. Use it to spot an unexpected shape—for example, a session that generated stories without the intended parent levels—but review the session hierarchy before drawing a quality conclusion from counts alone.
Recent sessions
Recent PBI Sessions lists the latest saved work with its status and item count. Open a row to review the persisted source, configuration, hierarchy, and available actions. The Dashboard is a shortcut; the complete searchable history remains in PBI Sessions.
Quick actions
- Generate New PBI opens Smart PBI Generation.
- Upload Files opens File Management.
- Session History opens PBI Sessions.
If the totals look unfamiliar, check the active project before changing filters or starting another generation. Smart PBI data is project-scoped.
