Accessibility Dashboard
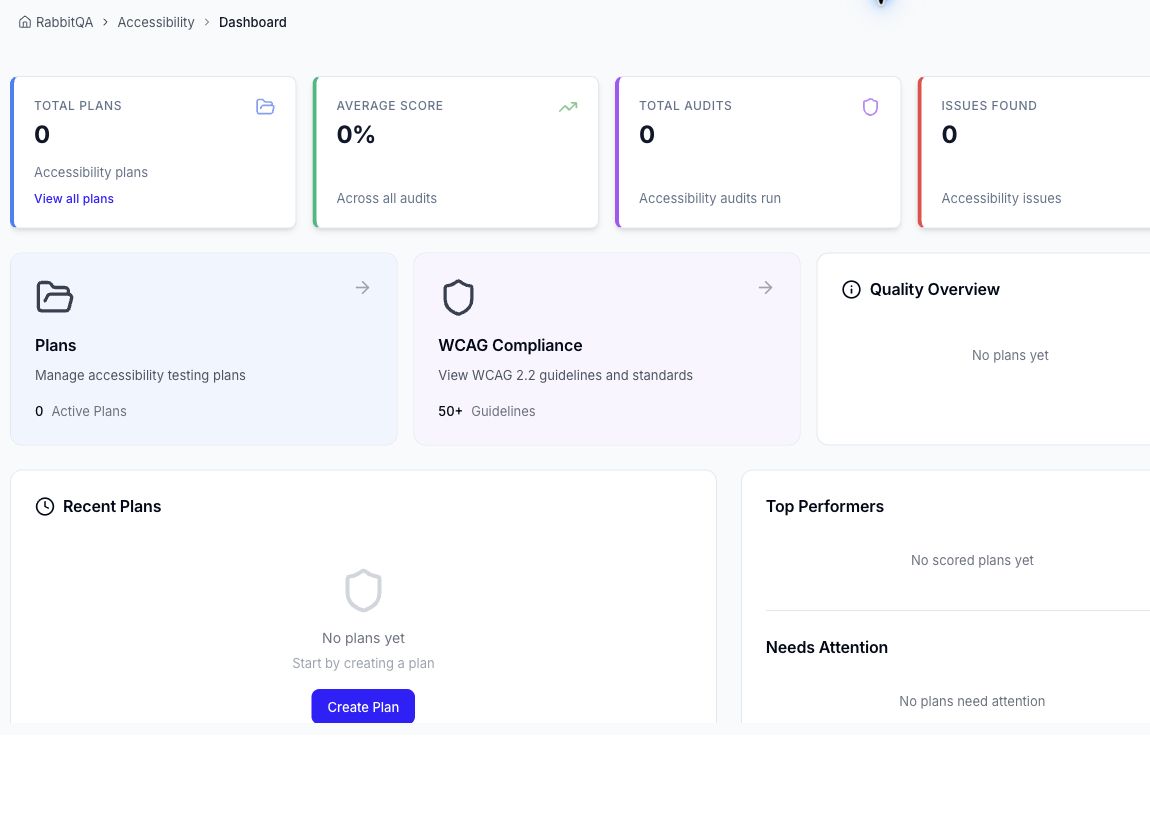
The Dashboard summarizes the current workspace. It is an entry point to plans and the WCAG 2.2 reference, not a replacement for the detailed audit reports.
Summary cards
| Card | Meaning |
|---|---|
| Total Plans | Accessibility plans in the selected workspace. |
| Average Score | Average latest accessibility score across scored audits. |
| Total Audits | Accessibility audits recorded for the workspace. |
| Issues Found | Findings represented in the dashboard summary. |
Dashboard sections
- Plans opens plan management.
- WCAG Compliance opens the WCAG 2.2 reference.
- Quality Overview groups scored plans into Excellent (90–100), Good (75–89), Fair (60–74), and Needs Attention bands. Unscored plans are kept separate.
- Recent Plans shows recently used plans.
- Top Performers highlights the strongest latest scores.
- Needs Attention highlights plans whose latest score is in the lowest band.
An empty workspace displays zero values and a Create Plan action. Metrics begin to populate after plans and completed audit results exist.
