RabbitQA Dashboard
Unified view of all testing activities across the platform.
What is RabbitQA Dashboard?
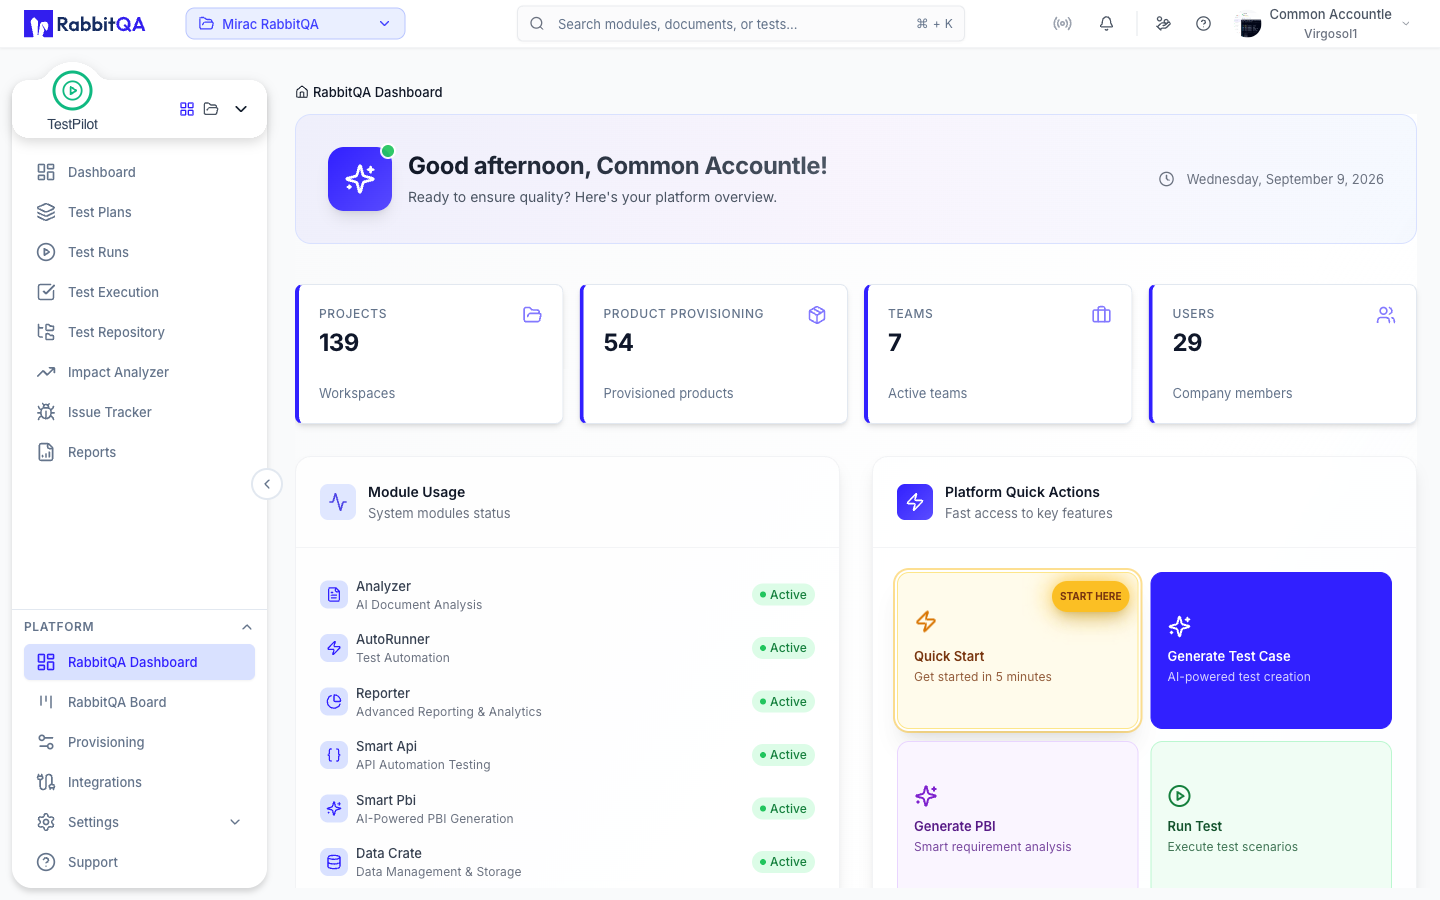
RabbitQA Dashboard provides a centralized view of all testing activities, metrics, and system health across Analyzer, CaseWriter, TestPilot, and other RabbitQA modules.
It serves as your command center, giving you real-time visibility into platform-wide testing operations, project status, and key performance indicators.
Key Metrics
Platform Overview
View total projects, active test runs, completed tests, and overall pass rates across all modules. Track platform-wide testing velocity and quality metrics.
Module Activities
Monitor activities from Analyzer (document analysis, PBI generation), CaseWriter (test case creation), TestPilot (test execution), and other modules in a single view.
Recent Activities
See recent document uploads, test case creations, test executions, and other platform activities. Track what's happening across your entire testing ecosystem.
System Health
Monitor platform health, integration status, system performance, and any alerts or issues that require attention.
Dashboard Features
- Unified Metrics: Aggregate data from all modules in one place
- Real-time Updates: Live updates of testing activities and metrics
- Quick Navigation: Quick access to all modules and key features
- Customizable Views: Customize dashboard layout and visible metrics
- Trend Analysis: View historical trends and performance over time
Using the Dashboard
Access the dashboard from the platform menu or by navigating to the Dashboard link. Review metrics to understand overall platform activity, click on any metric to drill down into details, and use quick links to navigate to specific modules or projects.
Customize the dashboard layout to focus on metrics most important to your role and organization.
