Run Detail
The run detail page is where you investigate a single run. Open it from any row in Test Runs, or from a dashboard or report link.
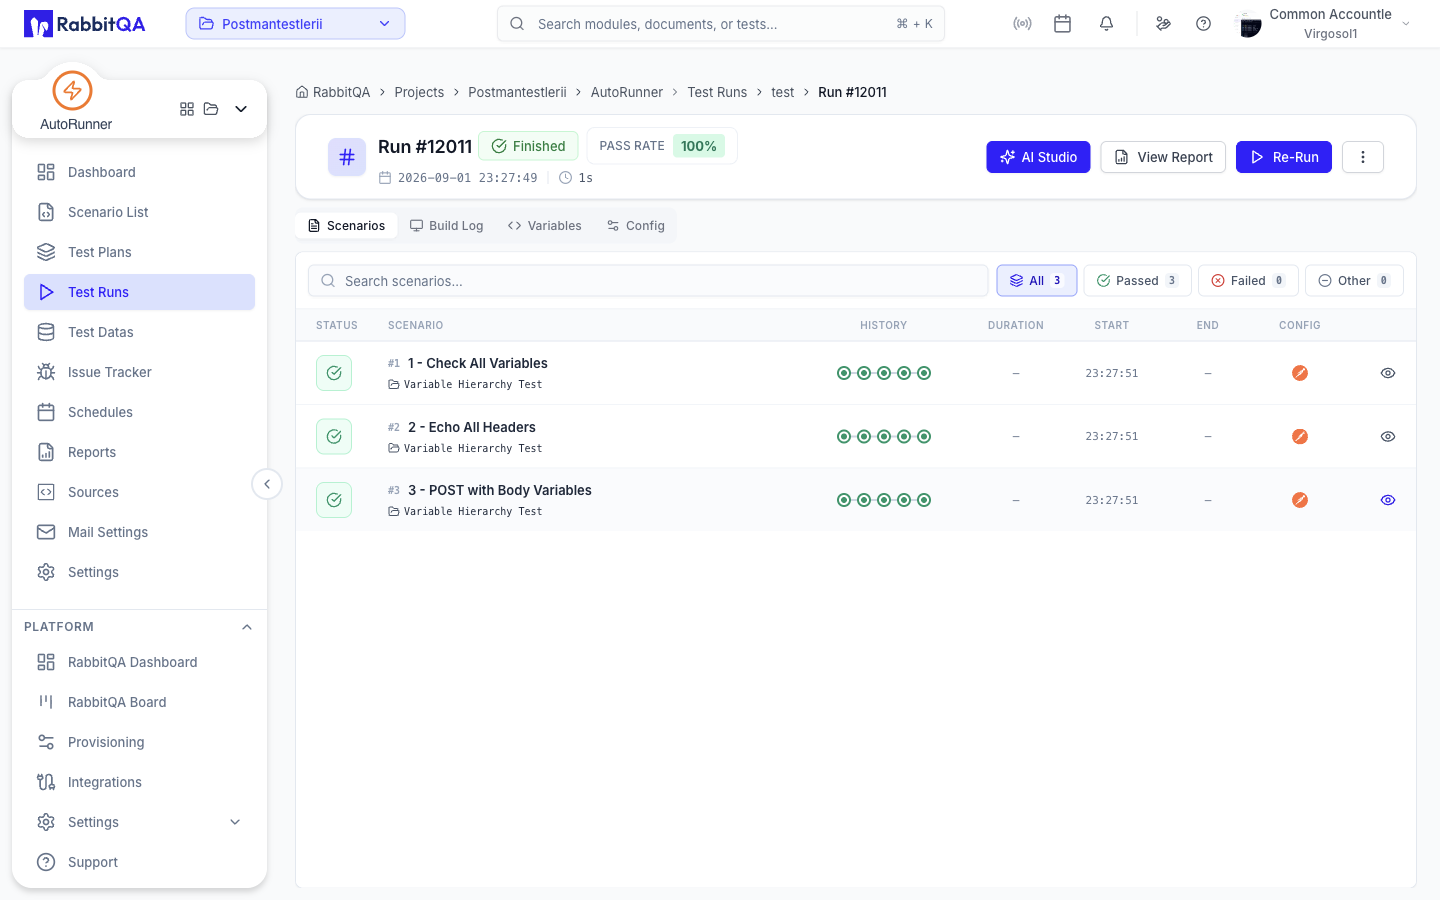
Header
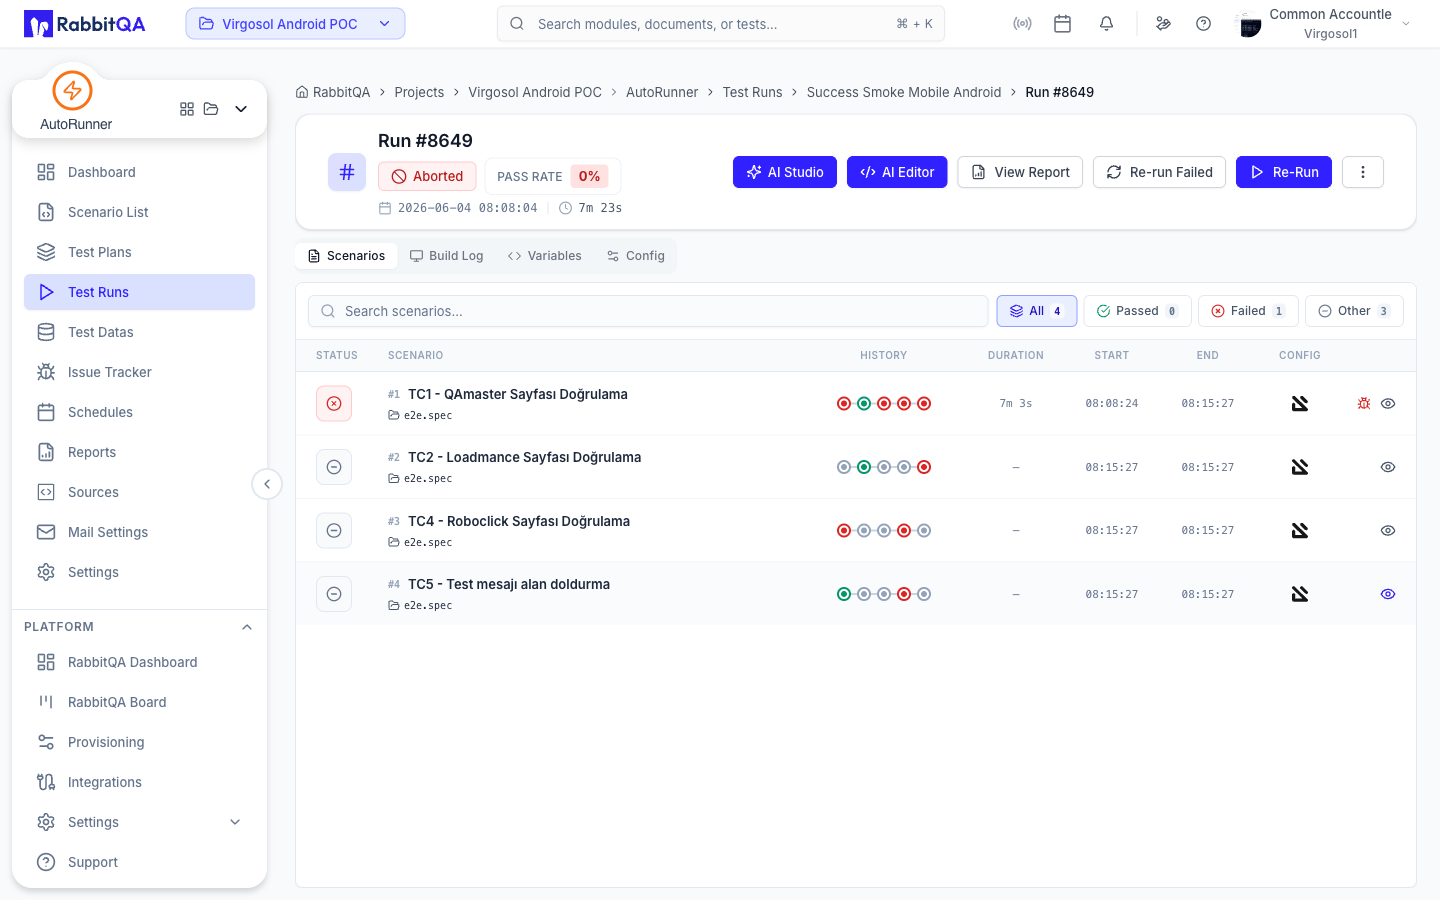
The header shows Run #id, the run status badge, and a Pass Rate chip with a tooltip giving the passed-out-of-total scenario count.
Below the title you get the start timestamp and either a live Running indicator or the final duration.
| Action | Availability |
|---|---|
| View Report | Once the run is no longer running |
| Re-Run | With run-create permission |
| Stop Run | While the run is running |
| View All Runs | Always, in the overflow menu |
| Delete | Ended runs, with delete permission |
While the run is active the page refreshes on its own every two seconds. A run that is still queued shows Preparing to start... until the runner initializes.
Self-Healing Activity
If the run raised any heal events, a Self-Healing strip appears between the header and the tabs with counts for awaiting review, applied, and rejected.
Expand it for the chronological event list — step number, platform, time, and the agent's reasoning. Selecting an event opens its review dialog.
See Element Registry for what happens when you accept or reject a heal proposal.
Page Tabs
| Tab | Content |
|---|---|
| Scenarios | Every scenario in the run. The default tab. |
| Build Log | The run-level build log. Shown only when the run contains a non-AI-agent scenario. |
| Variables | Runtime variables the run resolved. |
| Config | The configuration the run executed with. |
Scenarios
Search by name and filter with the counted buttons All, Passed, Failed, and Other (skipped, aborted, or untested).
Columns: Status, Scenario, History, Duration, Start, End, Config.
Failed rows offer a Report bug for this scenario action when you have issue-create permission. Selecting a row opens the scenario drawer.
Build Log
An infinite-scrolling viewer over the run's build log, with line numbers and entries formatted as timestamp, level, source, and message. It ends with an explicit end-of-log marker and does not poll.
Variables
Runtime variables are split by scope into Run Variables and Scenario Variables. A variable set for the whole run has run scope; one produced inside a scenario has scenario scope.
Config
- Run Profile — profile name and its execution targets, including browser, device, platform, resolution, and provider. API-only targets are labelled "No browser needed".
- Execution settings — Environment, Parallel, Retry, Timeout, Mode, Window Size, Screenshots (On Fail, On Pass, or Disabled), Notification, and Frameworks.
- Run facts — Scenarios, Duration, Date, Time Range, Triggered By, and Engine.
Scenario Drawer
Selecting a scenario opens a resizable drawer on the right. The header carries the scenario name, its position in the run, the execution target, retry Attempts chips, Report Bug on failures, and Previous / Next navigation. The drawer is deep-linkable, so you can share a URL that opens straight to one scenario.
Which tabs appear depends on the scenario's own framework, because one run can mix frameworks.
| Tab | Shown when |
|---|---|
| Scenarios | Always |
| Live | The run is live and this scenario is executing |
| Steps | Always |
| Logs | The scenario is not AI-agent |
| Requests | The scenario is Postman |
| Network | The scenario is neither AI-agent nor Postman |
| Watch Video | A mobile session recording or a completed browser recording exists |
| Variables | Always |
Scenarios
A read-only view of the scenario definition, rendered for its framework:
- AI-agent scenarios use the AI Studio details view.
- Postman scenarios show the request detail.
- Gauge and BDD scenarios show the reconstructed source text.
This tab is read-only. To change the scenario, open it in AI Studio or the AI Editor.
Steps
The step list opens with a summary band that doubles as the filter: total step count, then chips for passed, failed, and info steps. When self-healing touched this scenario, an extra chip filters to self-healed steps only.
Screenshots appear inline against the steps that captured them. Select one to open the zoomable preview.
There is no separate Screenshots tab. Screenshots live on the steps that produced them.
Logs
A console view of the scenario log. While the run is live and this tab is open, the log tails every five seconds and the footer shows Streaming..., switching to All logs loaded when the run ends.
AI-agent scenarios do not have this tab. Their feed is the Chat panel on the Live tab.
Requests
For Postman scenarios, the request and response viewer for each executed request.
Network
The HTTP traffic captured during the scenario.
- Filter by URL, or by status class: All, 2XX, 3XX, 4XX, 5XX, Failed.
- Columns: Method, URL, Status, Type, Time, Size.
- The footer totals requests, failures, and transferred bytes.
- HAR downloads the trace for analysis in browser DevTools or another HTTP tool.
Watch Video
Plays the recording captured during execution — the browser recording for a web run, or the session recordings for a mobile device run. The player supports play, pause, and fullscreen, and lists every available recording.
Recordings appear once the upload completes. Until then the tab shows an empty state.
Variables
The scenario's own variables, plus the run variables shared with it.
Live Execution
While a run is executing, the Live tab in the scenario drawer streams the browser or device.
- The viewer header names the channel — Browser Live View for a browser session, Device Live View for a device.
- Refresh reconnects the stream.
- Use alternate view switches to a fallback channel when one is available, and Back to primary view returns.
- A fullscreen mode adds Stop and Exit Fullscreen.
Two side panels sit beside the viewer:
- Scenarios — the queue, with Queued, Preparing, and Running states.
- Steps and Chat — the executed steps, and the agent conversation for AI-agent runs.
AI Agent Controls
AI-agent runs add Pause and Resume to the live viewer, with PAUSED and WAITING FOR INPUT status badges. To end the run, use Stop Run in the page header.
When the agent asks a question, the Chat panel shows a Waiting for your answer card and the Chat tab pulses. Type your answer and send it to unblock the run. While the run is paused you can queue a message for when it resumes.
See AI Studio for the same controls during scenario generation.
Run Report
View Report opens a printable report for the run.
- Four stat cards — Passed, Failed, Untested, and Pass Rate.
- A Test Results Distribution bar with a legend.
- Display Filters — switches to show or hide failed, passed, and untested scenarios, and failed, passed, and info steps. These affect the page only.
- The Scenarios section, with failed scenarios expanded by default.
Export PDF opens a dialog where you choose what the file contains: step screenshots and their size, which scenario outcomes to include (untested scenarios are excluded by default), and which step outcomes to include.
Next Steps
- Test Runs — Back to the run history
- Element Registry — Review the heal proposals raised by this run
- Issue Tracker — Follow up on bugs reported from a failed scenario
- Reports — Trends across many runs
