Test Runs
Test Runs is the workspace run history. Track runs, review results, and act on them without leaving the list.
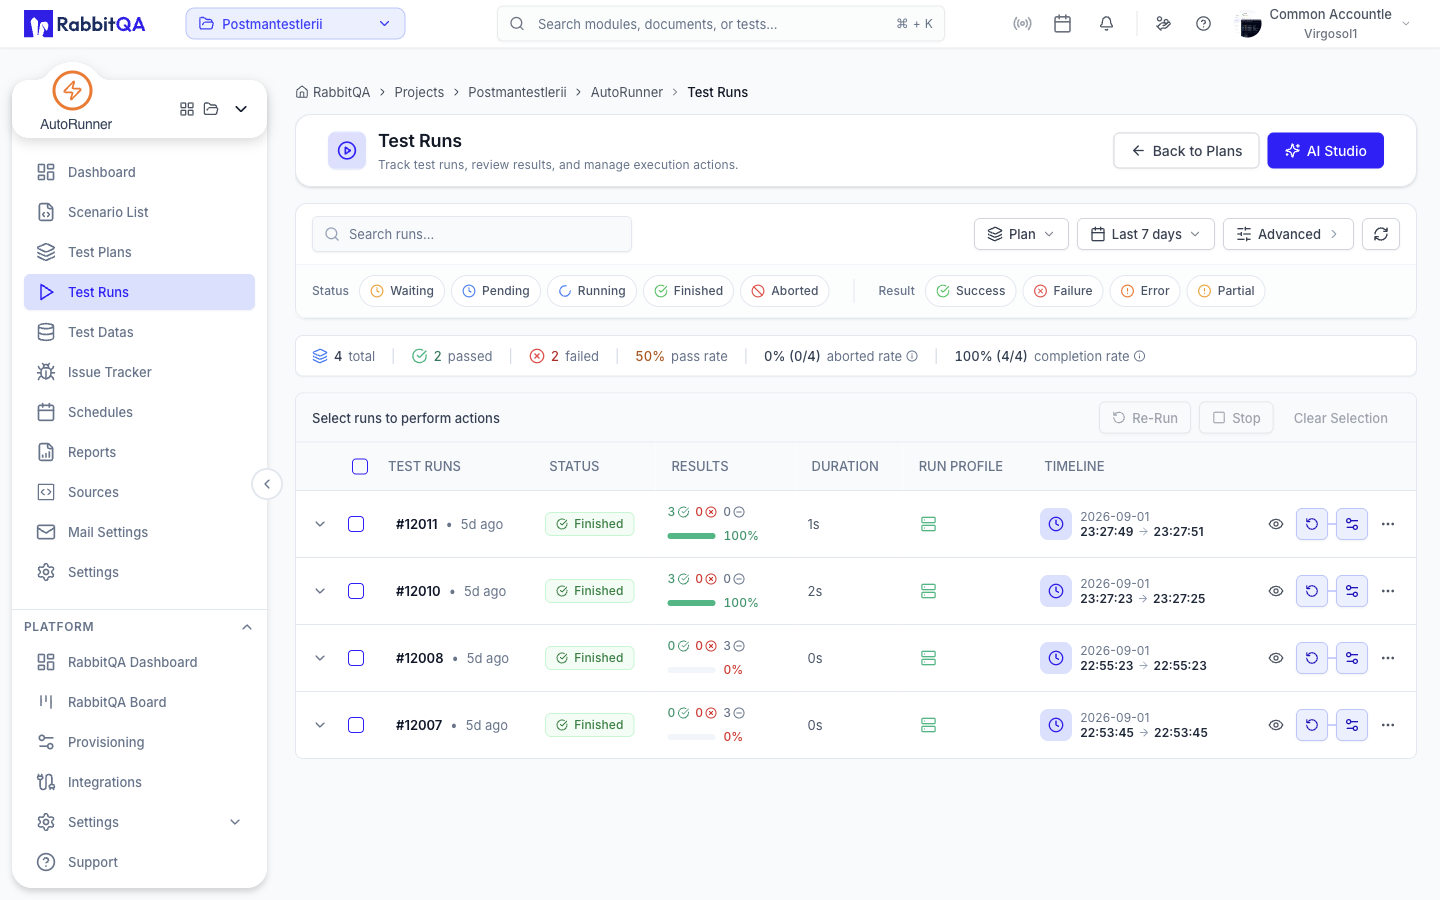
Run Statuses
A run carries a lifecycle status and, once it finishes, a result.
| Status | Meaning |
|---|---|
| Waiting | Queued, waiting for a runner |
| Pending | Preparing to run |
| Running | Executing |
| Finished | Complete — the result says how it went |
| Aborted | Stopped manually or cancelled by the system |
| Result | Meaning |
|---|---|
| Success | Every scenario passed |
| Failure | At least one scenario failed |
| Error | The run hit a system or infrastructure error |
| Partial | The run completed without covering every scenario |
Status badges use the shorter display words: a SUCCESS result shows as Passed and a FAILURE result shows as Failed.
The filter pills use the raw status and result names above.
Filtering
Search and Quick Filters
- Search runs — free-text search across the run history.
- Plan — narrow to one test plan, or All Plans.
- Date — Last 24 hours, Last 7 days (default), Last 30 days, Custom range, or All time. Choosing Custom range reveals a Pick dates calendar.
Status and Result Pills
Two rows of toggle pills sit under the toolbar. Both are multi-select, so you can combine several values.
- Status — Waiting, Pending, Running, Finished, Aborted
- Result — Success, Failure, Error, Partial
Advanced Filters
Select Advanced to reveal four more controls. The button carries a badge with the number of advanced filters currently active.
| Filter | Values |
|---|---|
| Runner | The runners present in the loaded runs |
| Environment | The environments present in the loaded runs |
| Trigger | How the run started |
| Group | How the list is grouped — see below |
Active Filters
Every filter you set appears as a removable chip in an Active: bar, with Clear All on the right.
Filters are written into the page URL, so you can bookmark a filtered view or share it, and the browser back button restores the previous filter state.
Flat and Grouped Views
The Group control switches the list between a flat table and grouped cards.
| Group by | Result |
|---|---|
| None | One flat table, 20 runs per page, with checkboxes and bulk actions |
| Run Group | Runs created together by one start request |
| Suite | Grouped by test plan, with Run Suite, Open Failed, and View Suite actions on the group header |
| Runner | Grouped by runner, with Show only this runner |
| Trigger | Grouped by how the run started |
Grouped views load 100 runs per page and expand the first group automatically. They do not offer checkboxes, bulk actions, or pagination.
Columns
| Column | Content |
|---|---|
| Test Runs | Run identity, plan, and — in flat view — the select-all checkbox |
| Status | Status badge, self-healing activity pill, and an error tooltip on failed runs |
| Results | Passed, failed, and untested counts, a stacked bar, and the pass rate or live progress |
| Duration | How long the run took |
| Run Profile | The profile the run executed with |
| Timeline | Run date, with start and end times |
The self-healing pill shows the run's total heal-event count and pulses when proposals are waiting for review. See Element Registry for how those proposals are reviewed.
Expanding a Row
The chevron on each row opens an inline Failed scenarios panel listing up to five failures, with Open run and Open run page links.
Row Actions
Inline buttons depend on the run's state:
- Quick View — opens a side sheet with the run summary without leaving the list.
- Stop run — on active runs, with a confirmation dialog.
- Re-run with same configuration — on ended runs. It reuses the original run profile without prompting.
- Run profile dropdown — re-run against a different profile.
The overflow menu adds:
| Action | Available on |
|---|---|
| View Detail Page | Any run |
| View Report | Runs that are no longer active |
| Watch Live | Active runs |
| Re-Run / Re-Run Failed (N) | Ended runs, with run-create permission |
| Copy Link | Any run |
| Refresh | Active and waiting runs |
| Delete | Ended runs, with delete permission |
Bulk Actions
In flat view, select runs with the row checkboxes to reveal a bulk bar with Re-Run, Stop, and Clear Selection.
- Re-Run activates only when the selection contains completed runs.
- Stop activates only when the selection contains active runs.
Summary Bar
When analytics data is available, a summary strip above the table shows total, passed, failed, aborted, pass rate, aborted rate, and completion rate.
- Abort rate is aborted runs divided by all runs in the window.
- Completion rate is ended runs (passed + failed + aborted) divided by all runs.
Next Steps
- Run Detail — Steps, logs, network traces, recordings, and variables for one run
- Test Plans — Change what a plan runs
- Settings — Run profiles and environments
- CI/CD Integration — Start the same runs from a pipeline
