Run Detail
Analyze every aspect of a completed or active test run through step-by-step results, console logs, network traces, and captured screenshots.
Overview
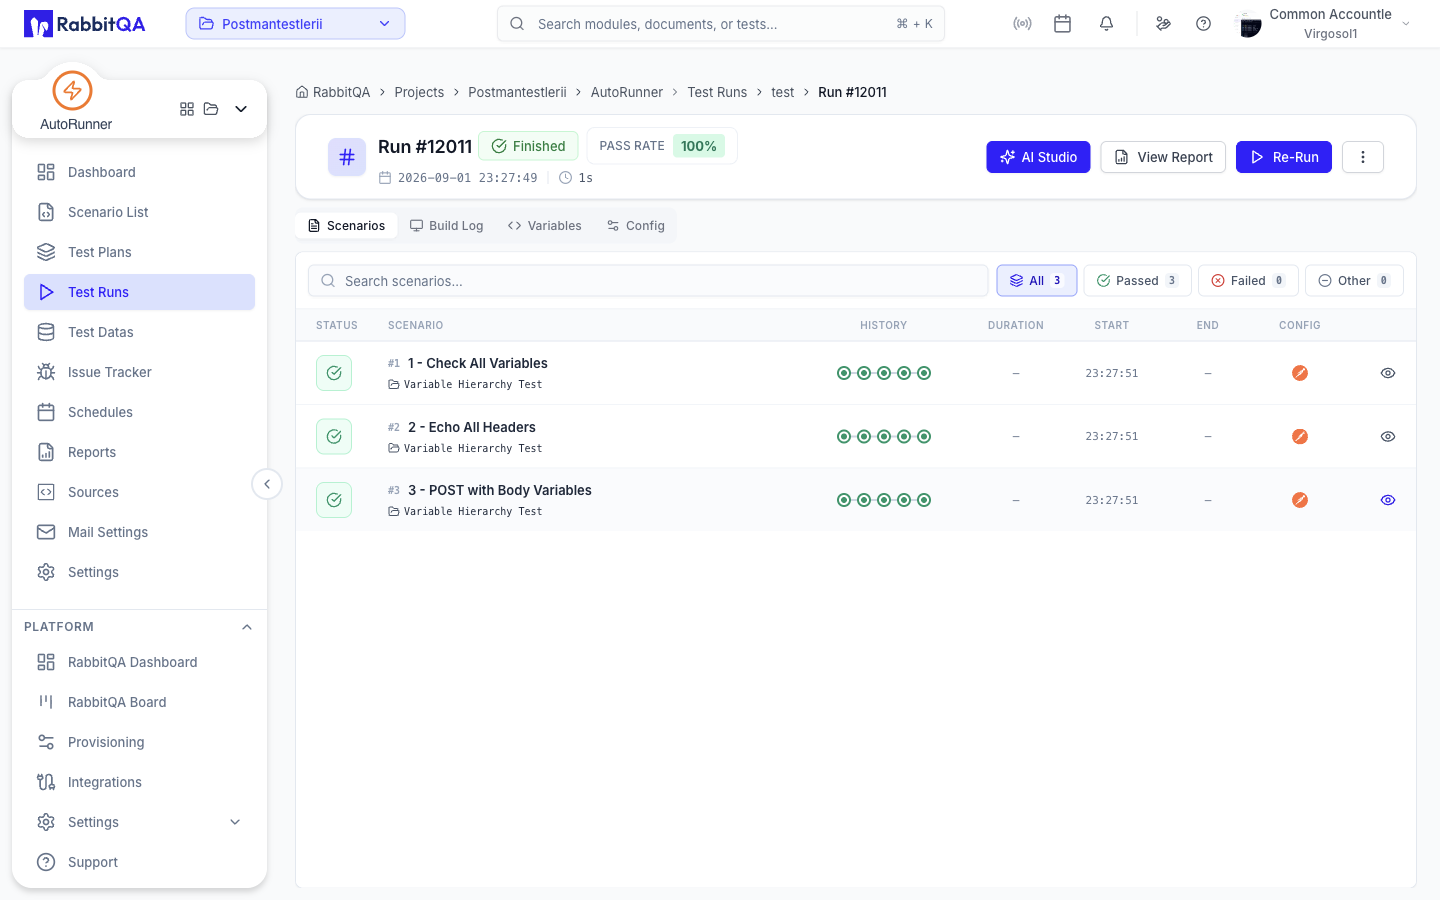
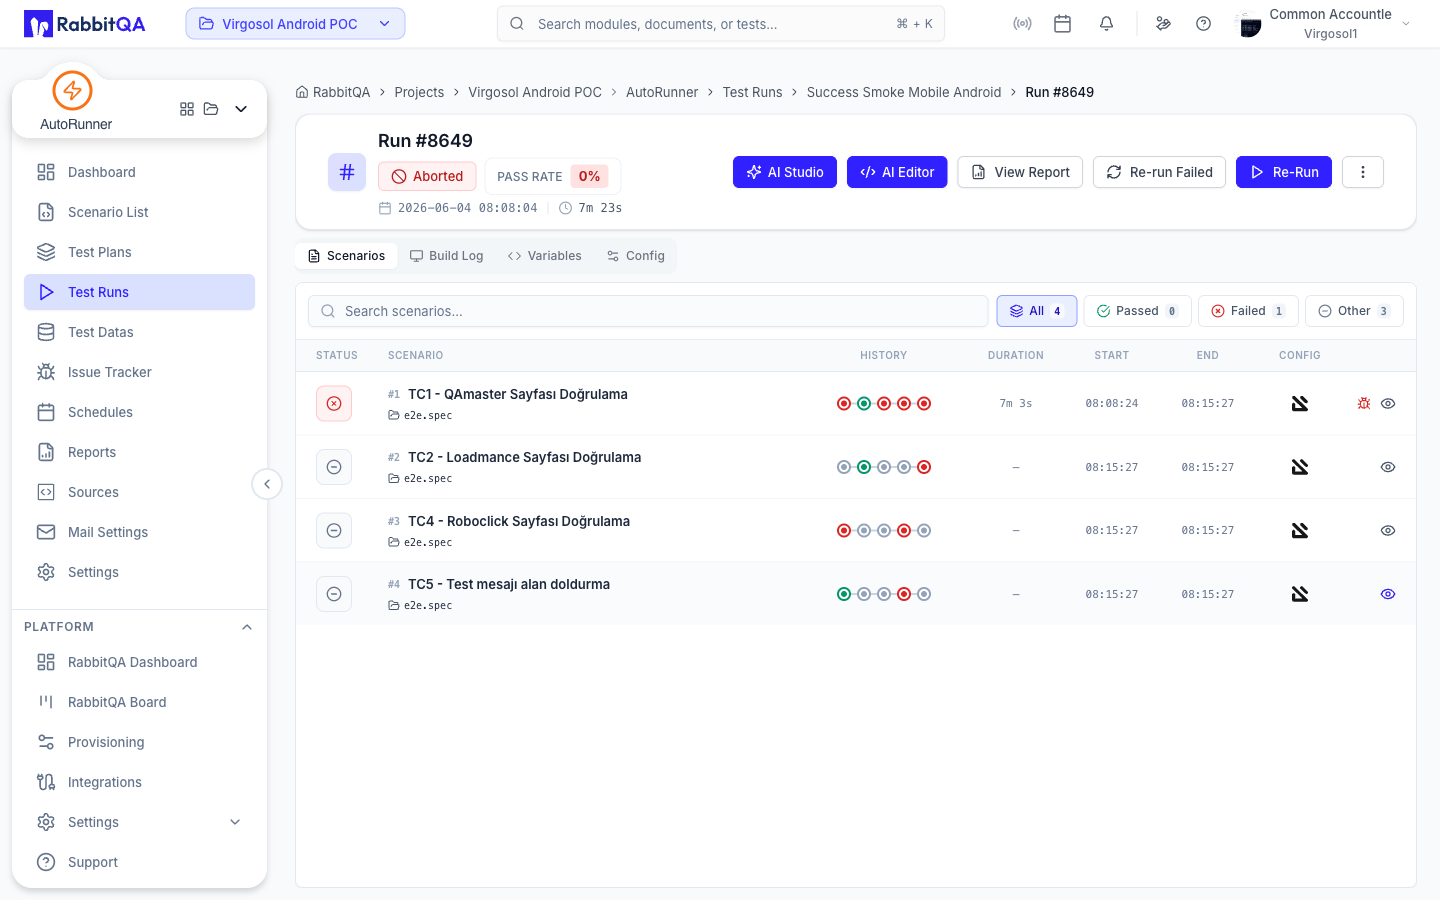
The Run Detail page is the primary interface for post-execution analysis. It provides a comprehensive breakdown of what happened during a test run, from high-level pass/fail statistics down to individual step errors and network requests. Access the run detail page by clicking any run entry from the Test Runner runs history, the suite runs tab, or the dashboard activity feed.
Header
The run detail header displays key run metadata at a glance:
| Element | Description |
|---|---|
| Status Badge | Color-coded badge showing the run's current status (Completed, Failed, Stopped, Running) |
| Framework Icon | Visual indicator of the test framework used (Gauge, Cucumber, Robot, Postman) |
| Duration | Total execution time from start to finish |
| Trigger Type | How the run was initiated: Manual, Scheduled, or CI/CD |
| Re-run Button | Start a new run with the same configuration |
| Stop Button | Halt an active run (visible only when status is Running) |
Stats Bar
Directly below the header, the stats bar summarizes execution results:
- Passed -- Number and count of scenarios that passed (green)
- Failed -- Number and count of scenarios that failed (red)
- Untested -- Scenarios that were skipped or not executed (gray)
- Pass Rate -- Overall pass rate as a percentage
- Total Scenarios -- Total number of scenarios in the run
- Duration -- Cumulative execution time
- Execution Date/Time -- Exact timestamp when the run started
Run Profile Snapshot
A collapsible accordion section displays the exact configuration used for the run:
- Execution targets (browser, device profiles)
- Browser and device driver configuration
- Environment variables applied
- Parallel execution settings
- Quality gate results (pass/fail against configured thresholds)
The run profile snapshot captures the configuration at the time of execution. Even if you change the suite's run profile later, the snapshot preserves what was actually used for this specific run.
Split-Pane Layout
The main content area uses a split-pane layout for efficient navigation:
- Left panel -- Scrollable list of all scenarios in the run. Each entry shows the scenario name, status icon, and duration. Use the search bar to filter by name and the status filter to show only passed, failed, or untested scenarios.
- Right panel -- Detailed analysis of the selected scenario, organized into four tabs.
Click any scenario in the left panel to load its details in the right panel.
Steps Tab
The Steps tab displays the step-by-step execution breakdown for the selected scenario.
Each step shows:
- Step text -- The Gherkin step or action description
- Status -- Color-coded indicator (green for passed, red for failed, gray for skipped)
- Duration -- Time taken to execute the step
Filter steps using the toolbar buttons: All, Passed, Failed, and Info.
For failed steps, the tab displays:
- The full error message with syntax-highlighted stack trace
- A screenshot captured at the point of failure (if available), with zoom and download controls
Click any screenshot thumbnail to open the full-size viewer. Use the zoom controls to inspect specific areas, and click Download to save the image locally.
Logs Tab
The Logs tab provides a console-style view of the complete execution log.
| Feature | Description |
|---|---|
| Infinite Scroll | Logs load progressively as you scroll, supporting runs with thousands of log entries |
| Auto-Scroll | Toggle auto-scroll to follow new log entries in real-time during active runs |
| Log Level Filtering | Filter by log level (Debug, Info, Warning, Error) to focus on relevant entries |
| Timestamps | Every log entry includes a precise timestamp |
| Search | Full-text search within log content to locate specific messages or error patterns |
Network Tab
The Network tab captures HTTP requests made during scenario execution, providing visibility into API interactions.
- Requests table -- Lists all HTTP requests with method, URL, status code, and response time.
- Request detail -- Click any request to expand its full request headers, body, and response payload.
- Status codes -- Color-coded indicators for success (2xx green), redirect (3xx blue), client error (4xx yellow), and server error (5xx red).
- Timing -- Request duration and time-to-first-byte metrics.
- HAR Download -- Export the full network trace as a HAR file for analysis in external tools such as browser DevTools or Charles Proxy.
Screenshots Tab
The Screenshots tab displays all screenshots captured during the scenario execution in a grid view.
- Click any thumbnail to open the full-size image viewer with zoom controls.
- Download Individual -- Save a single screenshot.
- Download All -- Export all screenshots for the scenario as a ZIP archive.
Live Monitoring
When viewing a run with Running status, the detail page enters live monitoring mode:
- The stats bar and progress bar auto-refresh as scenarios complete.
- The current scenario indicator highlights the scenario actively being executed.
- New log entries stream into the Logs tab when auto-scroll is enabled.
- The left panel scenario list updates status icons in real-time.
Re-run and Stop Actions
Re-run
Click the Re-run button in the header to start a new execution with the identical configuration, including browser, environment, parallel settings, and scenario selection. The new run appears in the runs history alongside the original.
Stop
Click the Stop button to halt an active run. A confirmation dialog appears before the run is stopped. Scenarios that have already completed retain their results. Remaining scenarios are marked as untested.
Next Steps
- Test Runner -- Return to the runs list and manage active executions
- Reports -- Generate trend analysis from multiple runs
- Test Suites -- Edit the suite configuration for future runs
- CI/CD Integration -- Automate runs from your deployment pipeline
