Dashboard
The BrowserHub dashboard summarizes browser capacity and activity for the selected RabbitQA project.
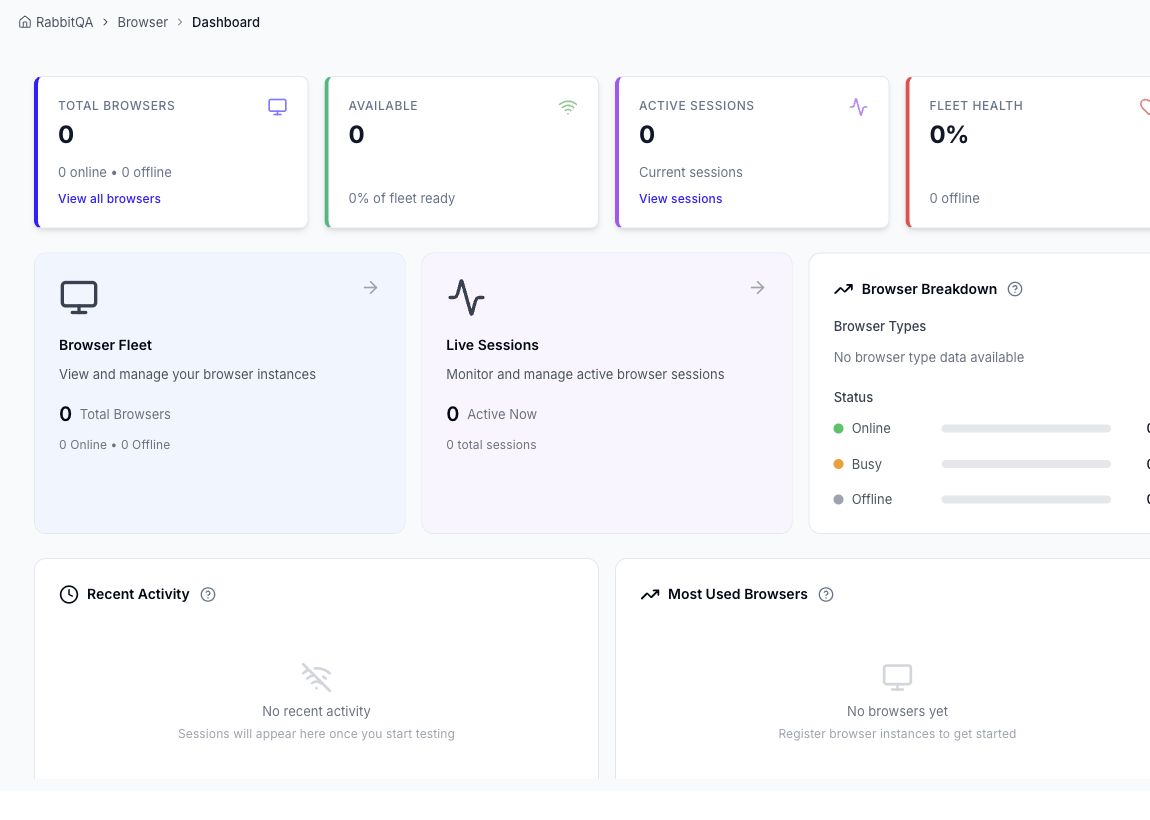
Dashboard areas
- Total Browsers, Available, Active Sessions, and Fleet Health provide the current capacity snapshot.
- Browser Fleet and Browser Breakdown summarize supplied capabilities.
- Live Sessions and Recent Activity show current and recent work.
- Most Used Browsers highlights demand by browser capability.
- Start New Session opens browser selection.
An empty state means the dashboard returned successfully but has no activity for the selected scope. A network error means the external Device Farm data could not be loaded; retry after connectivity is restored.
