Monitor Reports
View detailed performance data, uptime history, and incident logs for any individual monitor from a single report page.
What are Monitor Reports?
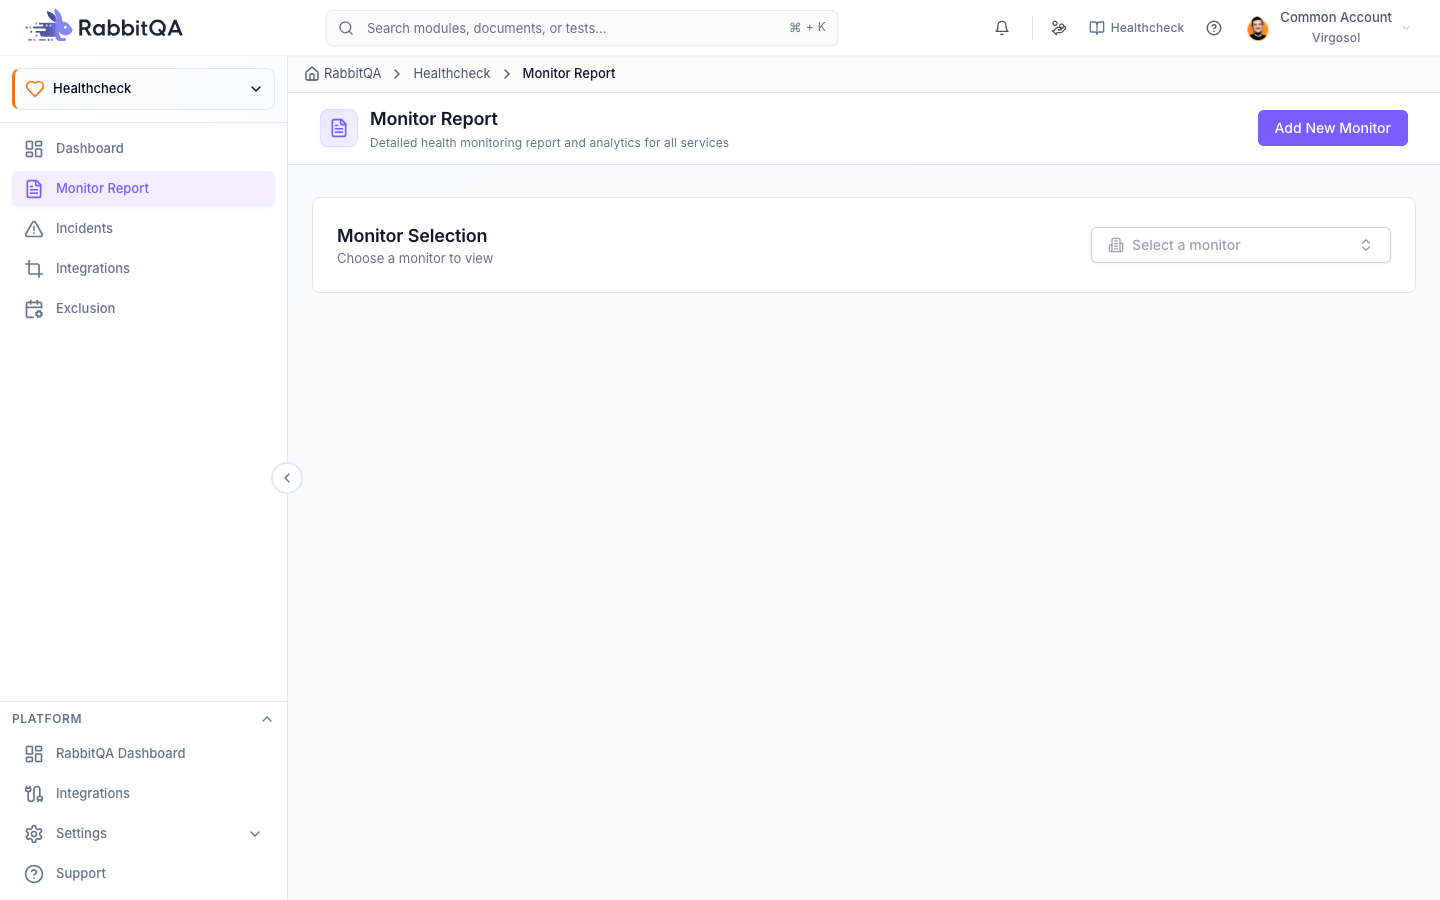
A Monitor Report is a dedicated detail page for a single monitor. It aggregates all collected data — current status, uptime graphs, response time charts, incident history, SSL information, and notification configuration — into one view, giving you a complete picture of that endpoint's health over time.
Accessing a Report
- Navigate to HealthCheck → Dashboard.
- Click any monitor row in the table.
- The monitor report page opens with all sections described below.
Report Sections
Current Status
A prominent status badge at the top of the report shows the monitor's current state:
| Status | Indicator | Meaning |
|---|---|---|
| Up | Green | All recent checks passed successfully |
| Down | Red | The monitor is currently failing checks |
| Degraded | Yellow | Checks pass but response time exceeds the warning threshold |
| Paused | Gray | Monitoring is temporarily disabled |
The status section also displays the target URL, monitor type, check interval, and the timestamp of the last check.
Uptime Graph
The status timeline visualizes uptime over a selectable time window (24 hours, 7 days, 30 days).
- Green segments represent periods where all checks passed.
- Red segments represent periods with active incidents.
- Yellow segments represent periods of degraded performance.
- Gray segments represent exclusion windows or paused periods.
Hover over any segment to see the exact time range and status.
Response Time Chart
A line chart plots response times for every check execution over the selected time window. Key features include:
- Average Response Time — A dashed baseline showing the monitor's average.
- Warning Threshold — A horizontal line at the configured KPI warning level.
- Critical Threshold — A horizontal line at the configured KPI critical level.
- Peaks and Valleys — Hover to inspect individual check results.
Use the 30-day view to identify recurring response time patterns. Consistent spikes at specific times often indicate scheduled batch jobs or traffic peaks that may need capacity adjustments.
Incident History
A list of all incidents associated with this monitor, displayed in reverse chronological order. Each entry shows:
| Field | Description |
|---|---|
| Date | When the incident started |
| Duration | Total downtime length |
| Cause | Failure reason (timeout, status code, DNS error, etc.) |
| Status | Resolved or Active |
Click any incident to navigate to its full detail page.
SSL Certificate Information
For SSL monitors (and HTTP/API monitors targeting HTTPS endpoints), this section displays:
| Field | Description |
|---|---|
| Issuer | Certificate authority that issued the certificate |
| Subject | Domain the certificate covers |
| Valid From | Certificate start date |
| Expires On | Certificate expiry date |
| Days Remaining | Countdown to expiry |
| Chain Valid | Whether the full certificate chain is valid |
Renew certificates before the expiry threshold you configured in the monitor's KPI settings. A 30-day threshold gives your team enough lead time to handle renewals without risking downtime.
Notification Methods
A summary of the alert channels configured for this monitor:
- Email — List of recipient addresses.
- SMS — List of phone numbers.
- Slack — Connected channel name.
- Webhook — Endpoint URL.
Click Edit Notifications to open the notification configuration panel.
Upcoming Exclusions
Lists any scheduled exclusion windows for this monitor, showing the date range and description. This helps you anticipate when alerting will be suppressed.
Days Without Incident
A counter displaying the number of consecutive days since the last resolved incident. This metric provides a quick reliability snapshot:
- Green badge — 30+ days without incident.
- Yellow badge — 7–29 days without incident.
- Red badge — Less than 7 days since the last incident.
Exporting Report Data
Click the Export button in the top-right corner to download report data:
- PDF — Formatted report suitable for stakeholder reviews.
- CSV — Raw check results for custom analysis.
Next Steps
- Investigate incidents listed in the report.
- Adjust KPI thresholds if the monitor frequently breaches targets.
- Schedule exclusion windows for upcoming maintenance.
