HealthCheck Module
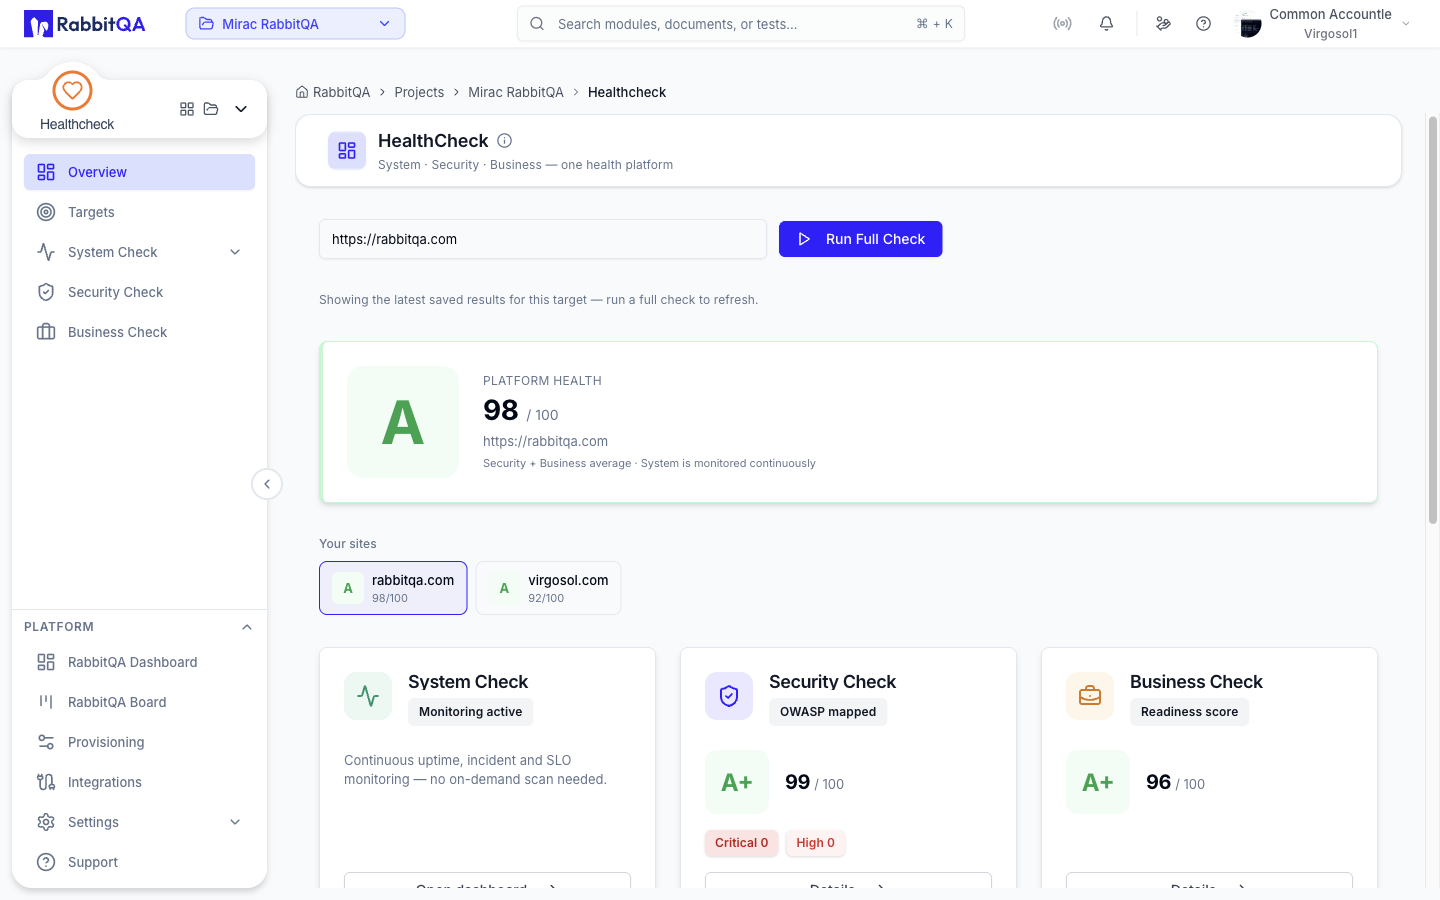
HealthCheck answers one question about a site — how healthy is it — from three angles at once.
The three pillars
| Pillar | What it covers | Where it lives |
|---|---|---|
| System Check | Uptime and protocol monitoring, incidents, alerting, SLOs, status pages, agents, observability | System Check |
| Security Check | Asynchronous security scans, findings, OWASP coverage, attack surface, site crawl | Security Check |
| Business Check | Asynchronous business assessments across seven domains, with an executive summary | Business Check |
System Check runs continuously against endpoints you configure. Security Check and Business Check run on demand against a URL and return a score.
The Overview screen
Opening HealthCheck from the sidebar lands on the Overview at /healthcheck.
It is the one place where all three pillars appear together.
Run a full check
- Enter a URL in the target field at the top of the page.
- Click Run Full Check.
A single click starts three things:
- a Security Check scan against the URL,
- a Business Check assessment against the same URL,
- a domain crawl, so the site's structure is covered too.
The Security and Business cards show Scanning… while the runs are in flight. The page polls for results and, if a run has not finished after roughly a minute, the card shows Check failed. Try again.
Run Full Check creates work, so it needs the create permission for HealthCheck. Without it the button is disabled and the tooltip reads You do not have permission to run a check.
Reading the results
Each completed pillar shows a letter grade and a score out of 100 returned by the backend. When both pillars finish, the Overview averages the two scores into a combined Platform Health grade:
| Combined score | Grade |
|---|---|
| 90-100 | A |
| 80-89 | B |
| 65-79 | C |
| 50-64 | D |
| Below 50 | F |
Below the pillar cards the Overview also shows:
- Your sites — every saved target plus any URL that appears in scan history, each with its combined grade. Selecting one loads its latest saved Security and Business results without re-running anything.
- What we check — a summary of the checks behind each pillar.
- Recent security scans and Recent business assessments — the last few runs, newest first.
When the page is showing stored results rather than a fresh run, a line above the cards says so.
Navigation
The module has five top-level entries.
| Entry | Path | Contents |
|---|---|---|
| Overview | /healthcheck | The three-pillar summary described above |
| Targets | /healthcheck/targets | Portfolio, Comparison, Reports, Monitoring |
| System Check | /healthcheck/dashboard | Dashboard, Monitors, Incidents, Status Pages, Alerting, Observability, Agents |
| Security Check | /healthcheck/security | Scorecard, OWASP Suites, Attack Surface, Domain Explorer |
| Business Check | /healthcheck/business | The business scorecard |
Several screens that used to have their own entry are now tabs. Older links still work and open the right tab:
| Old path | Now opens |
|---|---|
/healthcheck/compare | Targets → Comparison |
/healthcheck/reports | Targets → Reports |
/healthcheck/monitor-report | Targets → Reports → Monitor Report |
/healthcheck/scheduled-reports | Targets → Reports → Scheduled |
/healthcheck/monitoring | Targets → Monitoring |
/healthcheck/dashboards | Dashboard → Saved Layouts |
/healthcheck/slos | Dashboard → SLOs |
/healthcheck/runbooks | Incidents → Runbooks |
/healthcheck/exclusion | Alerting → Maintenance |
/healthcheck/integrations | Alerting → Channels |
/healthcheck/forecast | Observability → Forecast |
/healthcheck/explorer | Security Check → Domain Explorer |
Data scope
HealthCheck data is scoped to your company, not to a workspace.
The module does not read the X-Workspace-Id header, and its records do not carry a workspace
identifier.
Switching workspaces therefore does not change which monitors, targets, scans, or incidents you
see — everyone in the company works against the same HealthCheck data.
Access to the module itself is still governed by company licensing and the selected workspace's
enabled-module list.
API prefixes
The three pillars are served by one backend behind three distinct gateway prefixes:
| Prefix | Pillar |
|---|---|
/healthcheck/api/v1/** | System Check |
/security-check/api/v1/** | Security Check |
/business-check/api/v1/** | Business Check |
The heartbeat and metric push endpoints are public: the token in the path is the credential, and no session is required. See Monitors for those two push contracts.
Getting started
- Score a site. Enter a URL on the Overview and click Run Full Check to get Security and Business grades in one pass.
- Save it as a target. Add the URL under Targets so its grades are tracked over time and it appears in reports and comparisons.
- Add uptime monitoring. Create your first monitor under Monitors — start with the endpoint you would want paged about.
- Choose where alerts go. Connect a channel under Alerting.
- Watch for breakage. Review Incidents when a monitor fails.
Documentation
| Page | Description |
|---|---|
| Targets | The site portfolio, comparison, reports, and continuous monitoring |
| System Check | Uptime and protocol monitoring, and everything around it |
| Security Check | Security scans, findings, OWASP coverage, and attack surface |
| Business Check | Business-health assessments and the executive summary |
