Test Runner
Execute automated tests, monitor active runs in real-time, and review detailed results with step-by-step logs and performance metrics.
What is the Test Runner?
The Test Runner is AutoRunner's execution engine interface. It handles the full run lifecycle — from starting a test suite to displaying final results. You can monitor active runs in real-time, view step-by-step execution details, and access logs, screenshots, and performance metrics for every completed run.
Starting a Test Run
From the Suite Detail Page
- Navigate to your project and open a test suite.
- Click the Run button in the suite toolbar.
- Review the run configuration dialog:
| Setting | Description |
|---|---|
| Driver | Browser or device driver (Chrome, Firefox, Edge, Safari, Appium) |
| Environment | Target application environment |
| Tags | Run only scenarios matching specific tags |
| Parallel | Enable parallel scenario execution |
| Retries | Number of retries for failed scenarios |
- Click Start Run to begin execution.
Quick Run from Dashboard
- Open the Dashboard and click the Quick Run dropdown.
- Select a project and suite.
- Click Run Now to start with default configuration.
Run Status Lifecycle
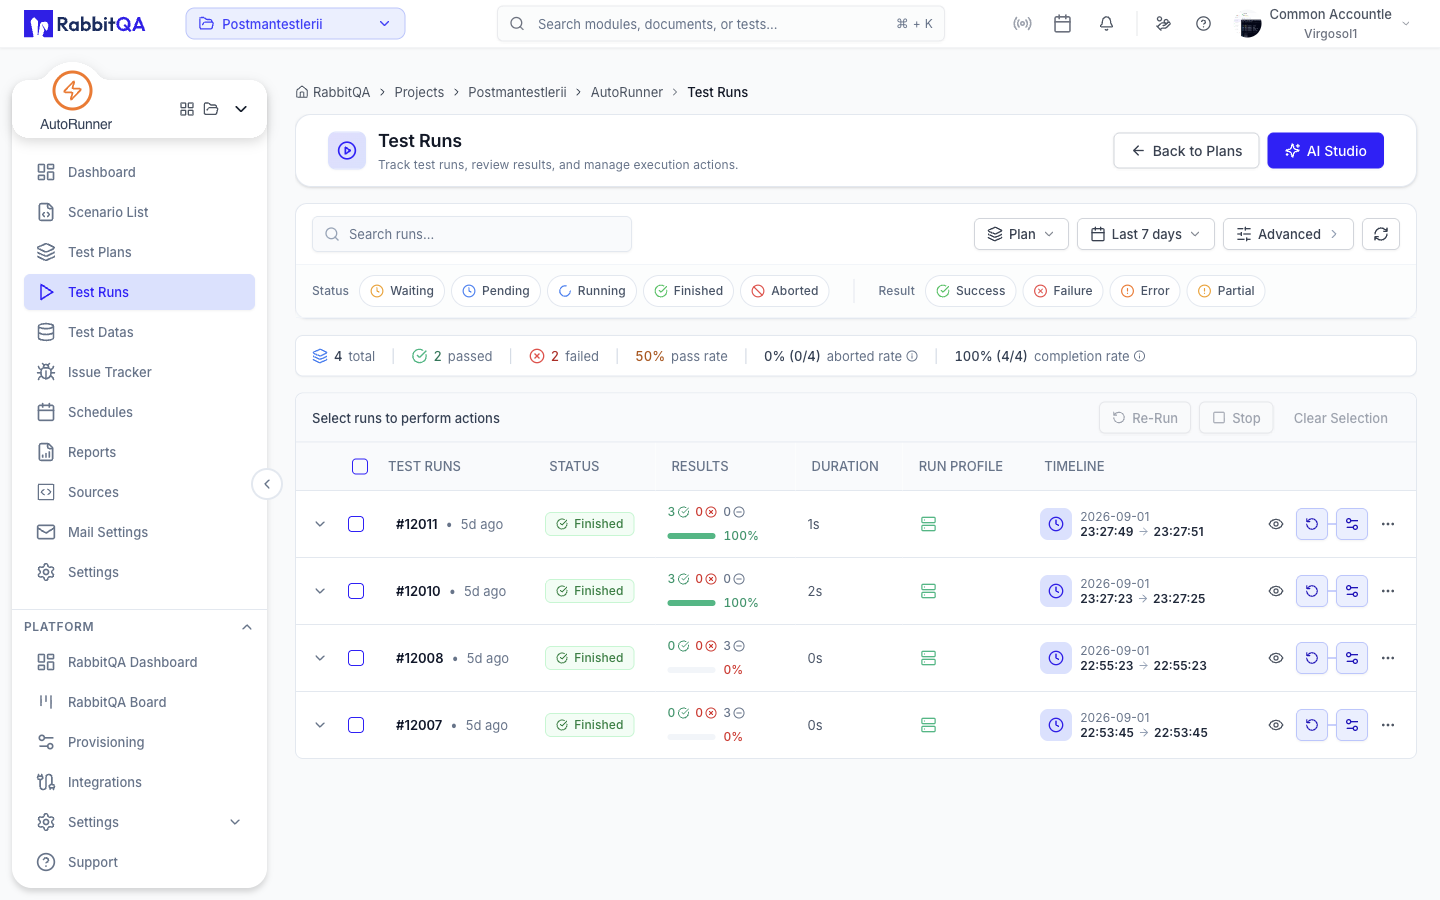
Every test run progresses through a defined status lifecycle:
PENDING → QUEUED → RUNNING → COMPLETED
                           → FAILED
                           → STOPPED
                           → TIMEOUT
| Status | Description |
|---|---|
| Pending | Run created, waiting for engine allocation |
| Queued | Assigned to engine, waiting in execution queue |
| Running | Actively executing test scenarios |
| Completed | All scenarios executed successfully |
| Failed | One or more scenarios failed during execution |
| Stopped | Manually stopped by a user |
| Timeout | Execution exceeded the configured time limit |
Each status has a color-coded badge: Pending (gray), Queued (blue), Running (purple), Completed (green), Failed (red), Stopped (orange), Timeout (yellow).
Active Runs Drawer
The Active Runs Drawer shows all currently executing runs across your projects.
To open the drawer:
- Click the Active Runs indicator in the AutoRunner header.
- The drawer slides open from the right side.
Each active run entry displays:
- Project and suite name
- Current status and progress bar
- Elapsed execution time
- Pass/fail count so far
- Stop button to halt execution
Live Monitoring
While a run is in Running status, you can monitor it in real-time:
- Click on an active run to open the run detail page.
- The page auto-refreshes as scenarios complete.
- View:
- Progress bar — Percentage of scenarios completed
- Live pass/fail count — Updated as each scenario finishes
- Current scenario — The scenario currently being executed
- Elapsed time — Total run duration so far
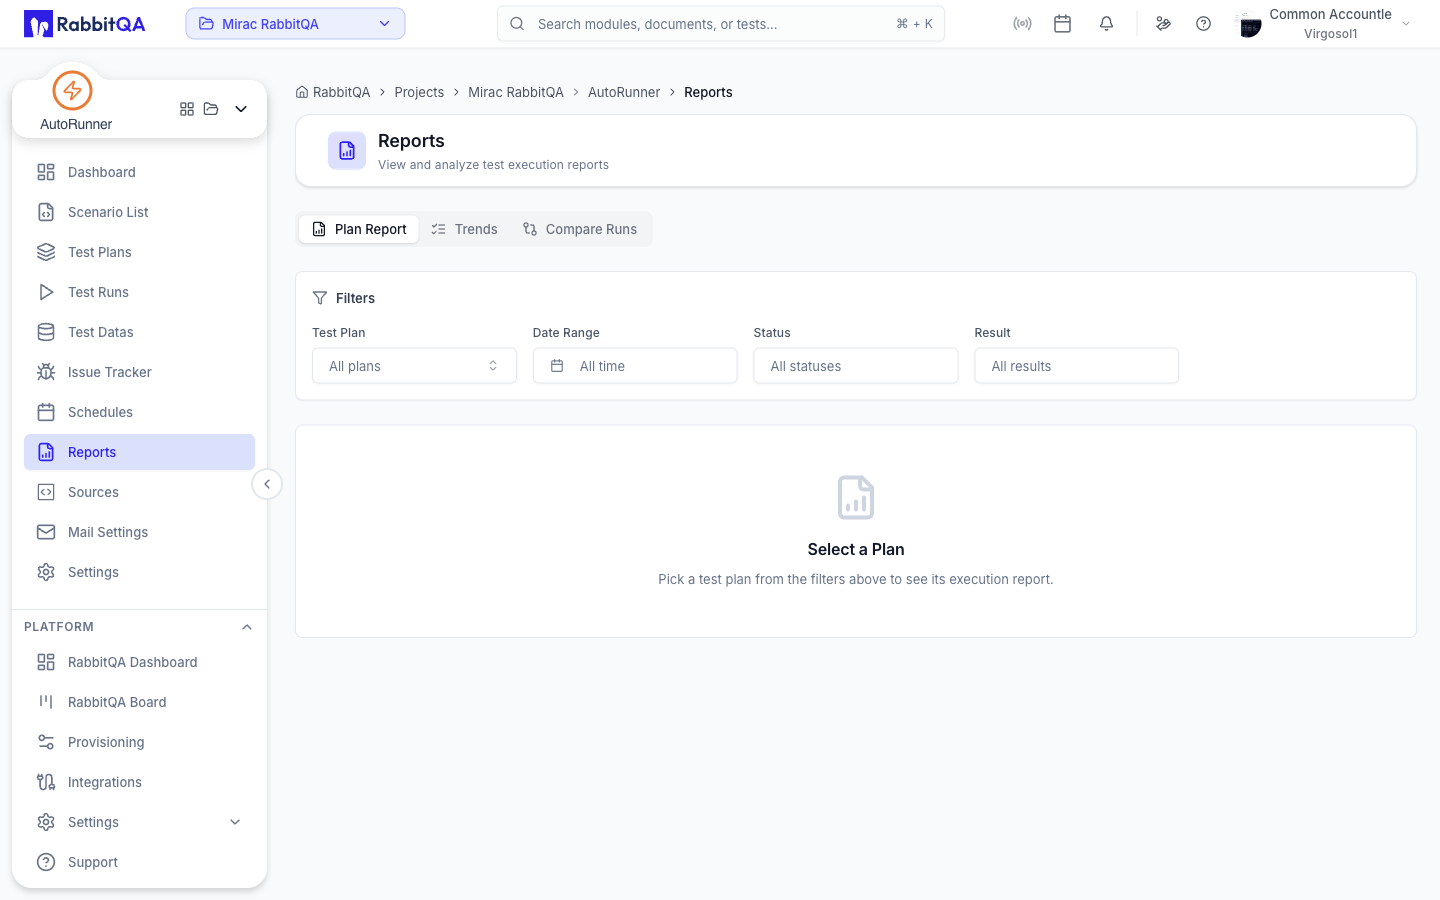
Run Detail Page
After a run completes, the detail page provides comprehensive results.
Summary Section
- Pass Rate — Percentage and count of passed scenarios
- Duration — Total execution time
- Framework — Framework used for execution
- Driver — Browser or device driver
- Started / Finished — Timestamps for run start and end
Step-by-Step Viewer
Expand any scenario to see individual step results:
| Column | Description |
|---|---|
| Step | Gherkin step text |
| Status | Passed, Failed, Skipped, or Pending |
| Duration | Time taken for the step |
| Screenshot | Captured screenshot (if available) |
| Error | Error message for failed steps |
Click on a failed step to expand the full error message and stack trace.
Logs Viewer
The logs tab displays the full execution log with:
- Timestamped log entries
- Framework-specific output
- Error messages and stack traces
- Driver and browser console logs
Use the search bar within logs to filter for specific entries.
Metrics Display
The metrics tab shows performance data for the run:
| Metric | Description |
|---|---|
| Total Duration | End-to-end execution time |
| Avg. Step Duration | Average time per step |
| Slowest Scenario | Scenario with the longest execution |
| Memory Usage | Peak memory consumption |
| Screenshots Captured | Total screenshots taken |
Parallel Execution
AutoRunner supports running multiple scenarios in parallel to reduce total execution time.
To enable parallel execution:
- Open the suite Settings panel.
- Enable Parallel Execution.
- Set the Max Concurrency value (e.g., 4 scenarios simultaneously).
- Start a run — scenarios execute concurrently up to the concurrency limit.
Ensure your scenarios are independent and do not share mutable state. Scenarios that depend on a specific execution order should not be run in parallel.
Stopping a Run
To stop an active run:
- Open the Active Runs drawer or navigate to the run detail page.
- Click the Stop button.
- Confirm the stop action in the dialog.
Stopping a run sets its status to Stopped. Completed scenarios retain their results; pending scenarios are marked as skipped.
Runs History
The Runs tab in the project or suite view displays a complete history of all test runs:
- Filter by status, date range, or driver
- Sort by date, duration, or pass rate
- Click any run to view its full detail page
- Compare pass rates across runs to identify trends
Next Steps
- Reports — Generate detailed analysis from your run results
- Scheduling — Automate recurring test runs
- CI/CD Integration — Trigger runs from your deployment pipeline
