HealthCheck Module
Monitor your APIs, services, and infrastructure endpoints around the clock with automated health checks, intelligent alerting, and detailed incident tracking.
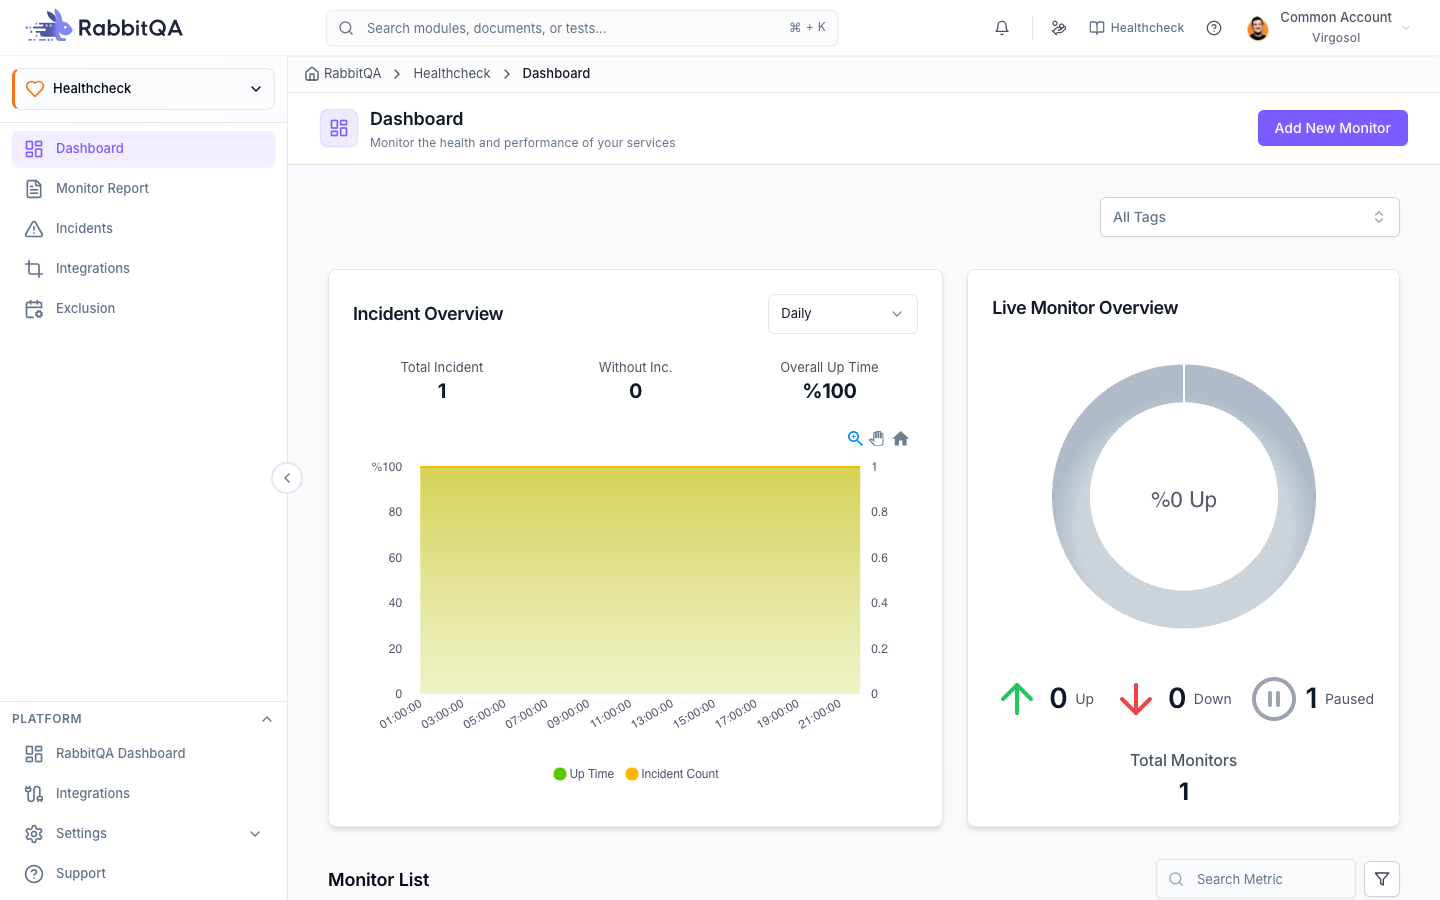
What is HealthCheck?
HealthCheck is RabbitQA's endpoint monitoring module. It continuously verifies that your services are reachable, responding within acceptable time frames, and returning the correct results. When something goes wrong, HealthCheck detects the issue, opens an incident, and notifies your team through the channels you configure.
Whether you are running a handful of internal APIs or hundreds of public-facing endpoints, HealthCheck provides the visibility you need to maintain high availability and respond to outages before your users notice.
Monitoring Types
HealthCheck supports multiple protocol-level checks so you can monitor every layer of your infrastructure:
| Type | What It Checks | Use Case |
|---|---|---|
| HTTP / HTTPS | Status code, response body, response time | REST APIs, web applications, webhooks |
| TCP | Port reachability and connection time | Databases, message queues, custom services |
| DNS | Record resolution and propagation | Domain health, DNS failover verification |
| SSL | Certificate validity, expiry, and chain integrity | Certificate renewal tracking, compliance |
| Ping | ICMP reachability and round-trip time | Network-level host monitoring |
Key Features
- Dashboard -- A single-pane view of all monitors with real-time status, uptime percentages, and response time trends.
- Flexible Check Intervals -- Schedule checks from every 30 seconds to every 24 hours, depending on how critical the endpoint is.
- Smart Alerting -- Configure failure thresholds, escalation policies, and notification channels (email, Slack, SMS, webhooks) so the right people hear about issues at the right time.
- Incident Management -- Automatic incident creation when consecutive failures exceed your threshold, with full timelines, root cause analysis, and correlated incident detection.
- Monitor Reports -- Per-monitor detail pages with uptime graphs, response time charts, SSL certificate info, and incident history.
- Exclusion Rules -- Suppress alerts during planned maintenance windows to avoid false alarms.
- Integrations -- Connect HealthCheck to Slack, Microsoft Teams, PagerDuty, OpsGenie, Jira, or any custom webhook endpoint.
- KPI Thresholds -- Set warning and critical response time targets so you catch performance degradation before it becomes an outage.
Getting Started
- Open HealthCheck -- Navigate to the HealthCheck module from the RabbitQA sidebar.
- Create your first monitor -- Click Add Monitor, enter the endpoint URL, select the check type, and set the interval. See API Monitoring for a detailed walkthrough.
- Configure alerts -- Add notification channels so your team is informed when a monitor fails. See Alerts for channel setup.
- Review incidents -- When a monitor triggers an incident, investigate the timeline, response time impact, and root cause from the Incidents page.
- Track uptime over time -- Open a monitor's report page to view historical uptime, response trends, and SSL certificate status.
Start with your most critical endpoints. Add HTTP monitors for your main API gateway and any third-party dependencies your application relies on. Expand coverage to internal services and infrastructure checks once the core monitors are in place.
Documentation
| Page | Description |
|---|---|
| API Monitoring | Creating and configuring endpoint monitors |
| Alerts | Setting up notification channels and alert rules |
| Incidents | Tracking, searching, and analyzing downtime events |
| Monitor Reports | Per-monitor uptime, performance, and SSL data |
| Exclusion Rules | Suppressing alerts during maintenance windows |
| Integrations | Connecting to Slack, PagerDuty, Jira, and webhooks |
