Dashboard
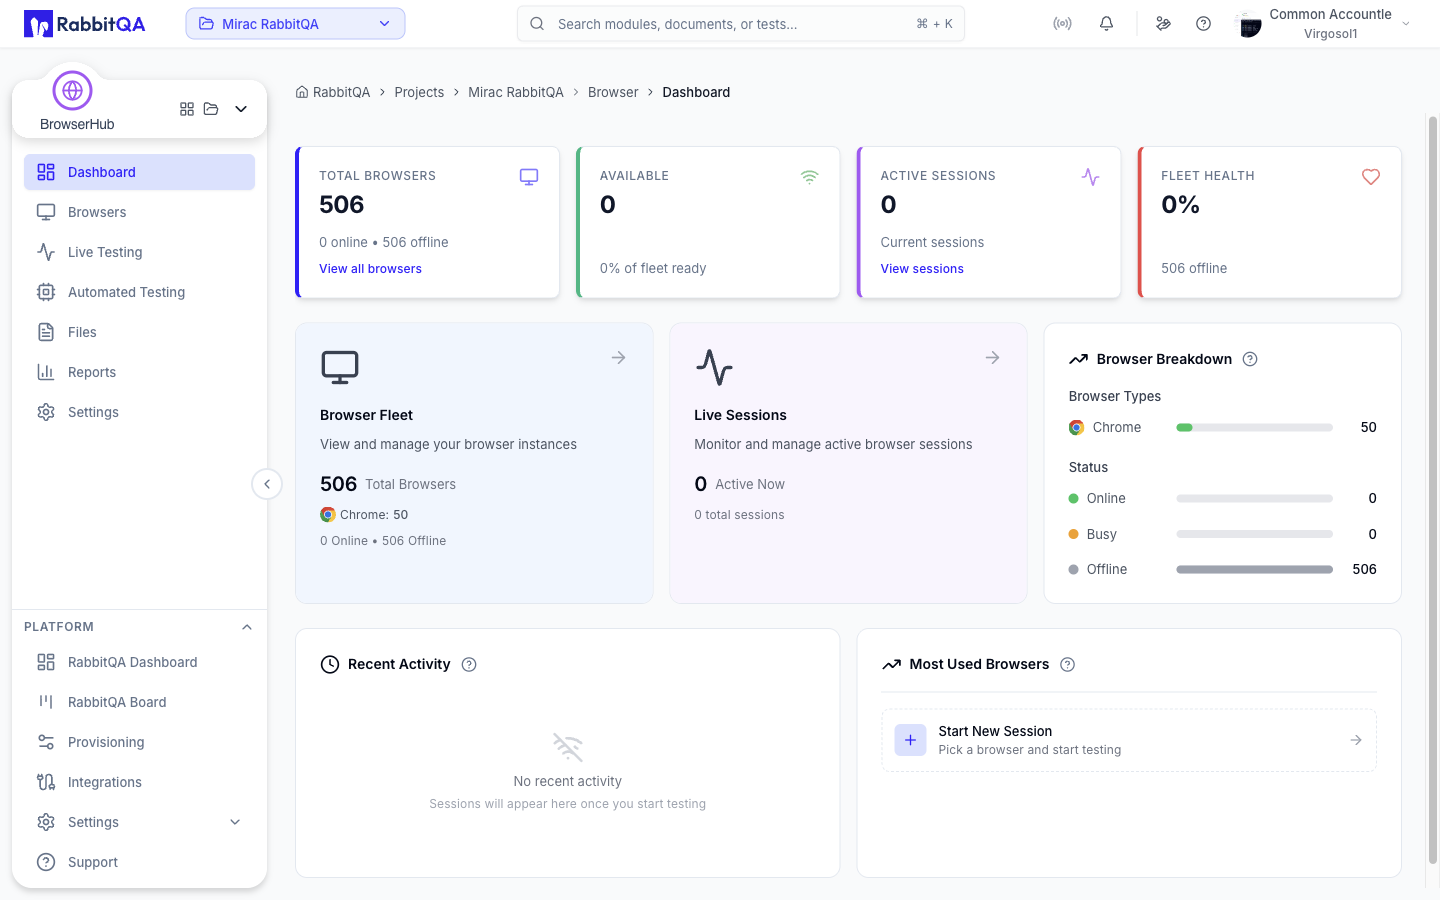
The landing page for BrowserHub at /browser/dashboard.
Opening /browser redirects here.
Metric Cards
Four cards summarize the browser pool at the top of the page.
| Card | Shows |
|---|---|
| Total Browsers | Total browser instances, with the online and offline split beneath |
| Available | Instances ready for immediate use, with the share of the pool that is ready |
| Active Sessions | Sessions running right now |
| Fleet Health | The share of instances that are online or in use, with the offline count beneath |
Total Browsers links to the Browsers page and Active Sessions links to Live Testing.
Health and status counts come from the service where it reports them, and are computed from the loaded browser list otherwise.
Quick Access Cards
| Card | Links to | Headline figure |
|---|---|---|
| Browser Fleet | /browser/browsers | Total browsers, with the online and offline split and counts for up to three browser types |
| Live Sessions | /browser/live-testing | Active sessions now, with the total session count |
Browser Breakdown
Proportional bars describe the composition of the pool in two groups.
- Browser types — one bar per browser type present in the pool, ordered by count.
- Status — Online, Busy, and Offline.
Recent Activity
A feed of the most recent browser sessions, each labeled as started or ended, with the browser and version, who created it, and how long ago.
Selecting an active entry opens that session. Selecting an ended entry opens the Live Testing list.
Most Used Browsers
A ranked list of up to five online or busy instances, with the browser, version, and status. Instances that are online carry a Start action that opens the Browsers page.
Below the list, Start New Session opens the Browsers page so you can pick a browser and version.
When the pool is empty, this panel invites you to register browser instances. Instances are registered by the browser farm service, not from within the application.
