Dashboard
The Dashboard at /healthcheck/dashboard is the System Check landing screen.
It holds three tabs.
| Tab | What it shows |
|---|---|
| Overview | Uptime, incidents, and monitor health at a glance |
| SLOs | Uptime targets and their error budgets |
| Saved Layouts | Your own dashboard compositions |
Overview
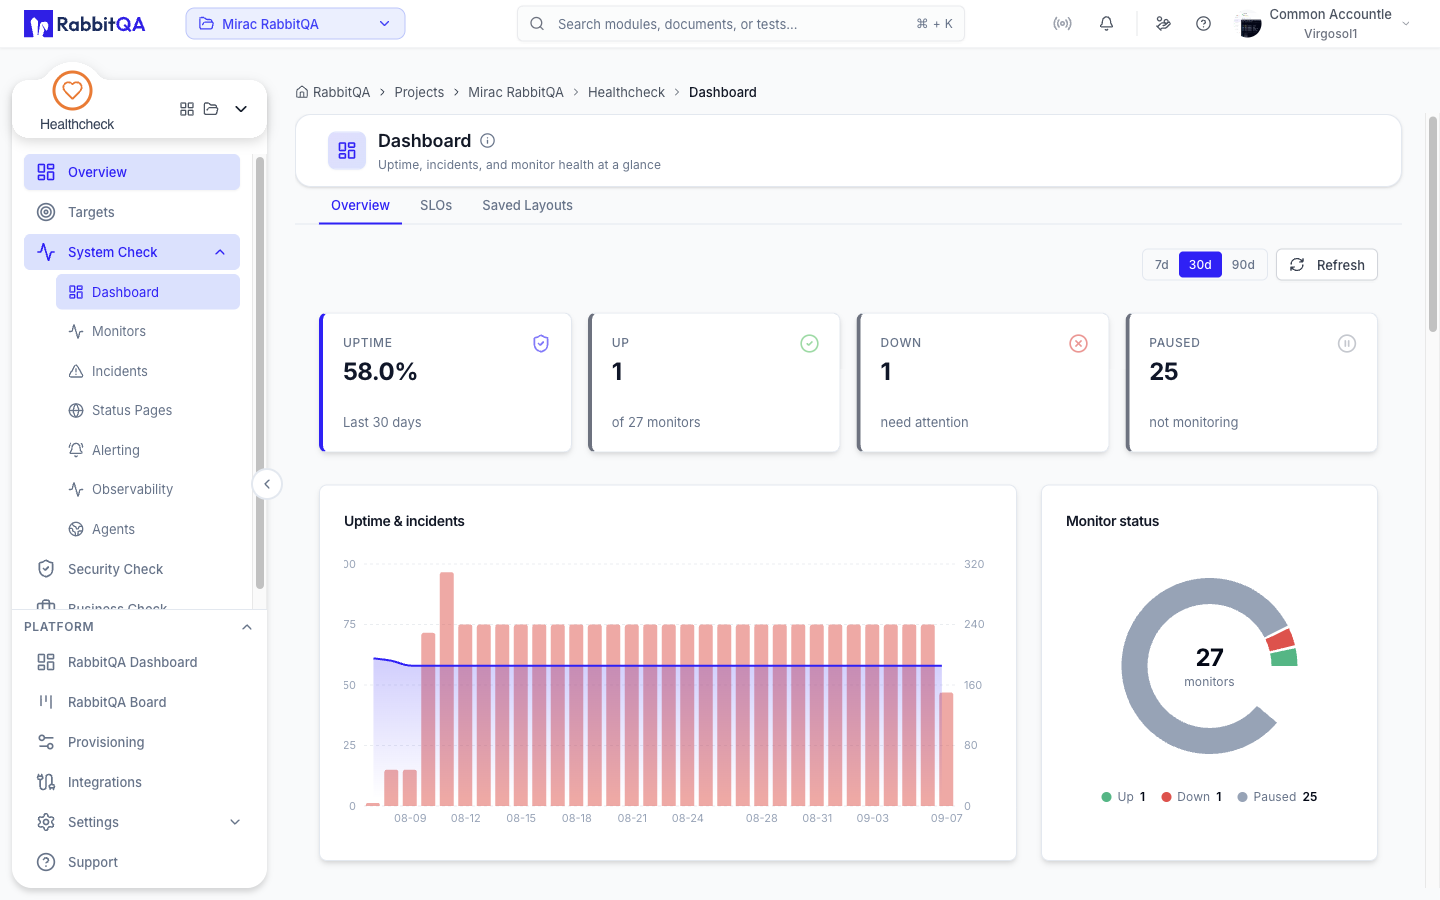 A range selector switches the whole tab between 7d, 30d, and 90d.
Four metric cards summarize the range:
| Card | Meaning |
|---|---|
| Uptime | Overall uptime across monitors for the selected range |
| Up | Monitors currently passing, out of the total |
| Down | Monitors that need attention |
| Paused | Monitors that are not being checked |
Below them:
- Uptime & incidents — a chart of uptime against incident count over the range.
- Monitor status — the distribution of monitors by status.
- Monitors — the monitor list, with columns for the monitor, its status, uptime, and interval. Selecting a row opens that monitor.
SLOs
An SLO tracks one monitor's uptime against a target percentage over a rolling window.
Three metric cards head the tab: SLOs defined, how many are Breaching, and the Avg budget left across them.
Creating an SLO
Click New SLO and fill in:
| Field | Notes |
|---|---|
| Monitor | The monitor whose uptime this SLO tracks |
| Name | For example API 99.9% uptime |
| Target % | Default 99.9, in steps of 0.1 |
| Window (days) | A free day count, default 30 |
The window is a number of days, not a fixed choice.
Reading an SLO
Each SLO carries an alert badge — Critical, Warning, or Healthy — and a line reading its monitor, target percentage, and window.
Beneath that:
- Error budget — a bar with the percentage of budget left.
- Current uptime for the window.
- Three burn figures, burn 1h, burn 6h, and burn 24h, shown in red when they exceed 1.
Expanding an SLO adds a burn-rate uptime chart. SLOs can be edited and deleted from the row.
Saved Layouts
Saved Layouts holds dashboards you compose yourself.
Click New dashboard and give it a Name, an optional Description, and optionally tick Make this the default dashboard. Existing dashboards can be renamed, made default, opened, or deleted.
Opening one shows its widgets and lets you add more. A widget is added by choosing a Widget type, an optional Title, and a width and height:
| Widget type |
|---|
monitor-status-grid |
uptime-summary |
response-time |
incident-list |
sla-gauge |
status-overview |
Saved Layouts manages composition only. Widgets currently render a size placeholder rather than live data — the screen itself says preview coming. Use the Overview tab for real numbers.
