Security Check
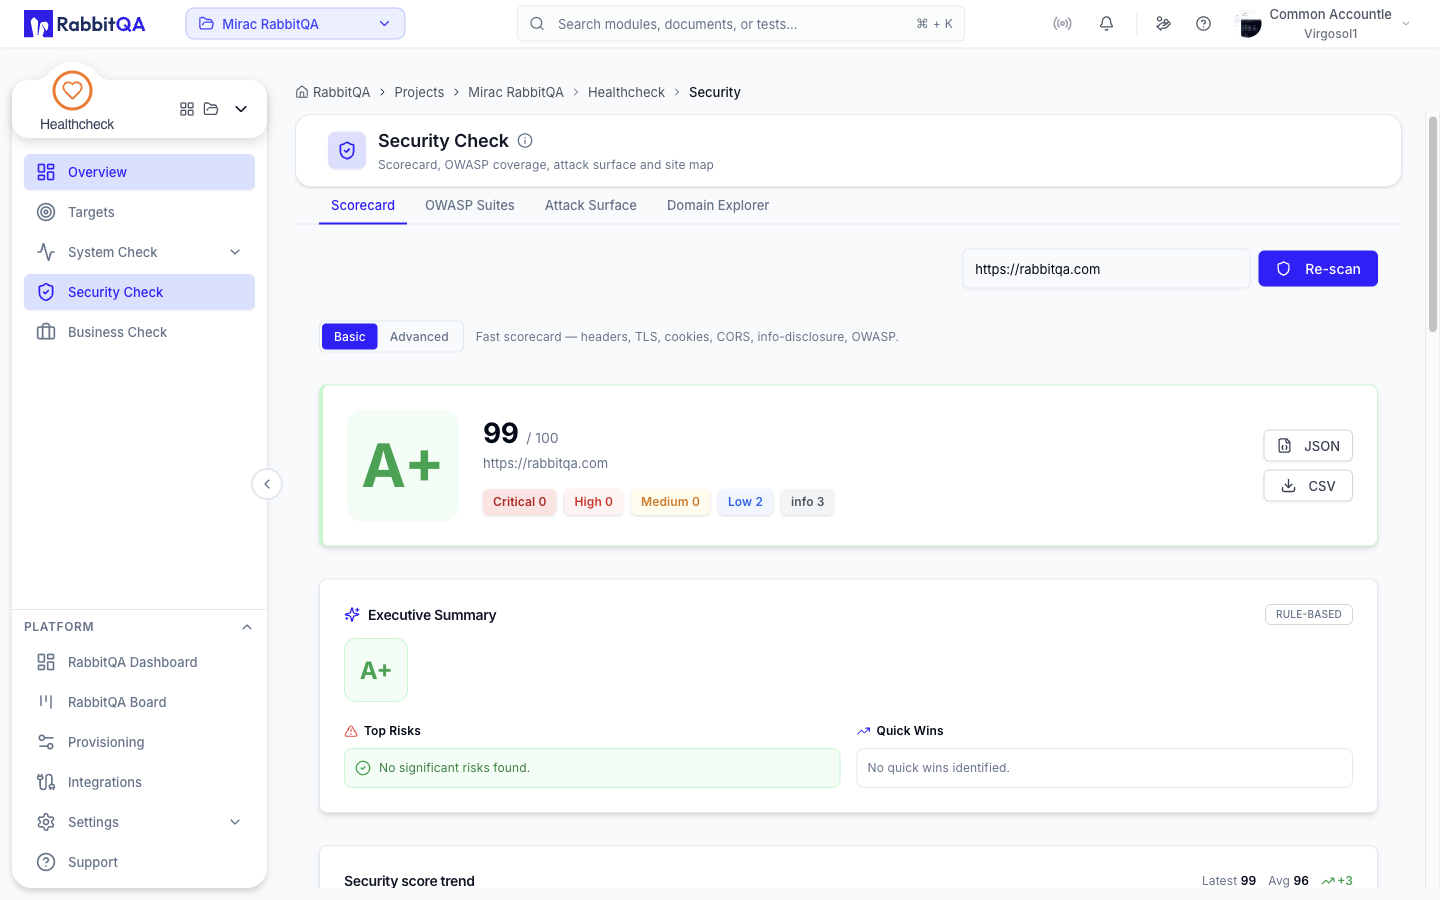
Security Check scores one domain's security posture. It probes HTTP headers, TLS, DNS, cookies, CORS, and information disclosure, maps what it finds onto OWASP categories, and reports the result as a graded scorecard.
The Security Check entry at /healthcheck/security holds four tabs.
| Tab | What it does |
|---|---|
| Scorecard | Runs a scan and shows the graded result with its findings |
| OWASP Suites | Browses the OWASP standards catalog and their category checklists |
| Attack Surface | Discovers subdomains and exposed hosts for a domain |
| Domain Explorer | Crawls a site and maps its pages and link structure |
Scorecard
Running a scan
- Enter a target URL in the field at the top.
- Click Run Scan.
The button reads Re-scan once a report is on screen.
Pressing Enter in the field starts the scan too.
Scans run asynchronously.
While one is in flight the page reports progress as {completed} of {total} checks, listing each
check as it finishes with the number of findings it produced.
If the scan has not finished within roughly a minute the page shows Scan Failed with a
Try Again button.
Starting a scan requires the create permission. Without it the run controls are disabled and a notice explains that you can review saved scans, their findings, and the exports, but not start a new one.
When you open the tab it loads the newest completed scan automatically, so you land on a report rather than an empty screen.
Basic and Advanced
A segmented control offers Basic and Advanced.
- Basic — the fast scorecard: headers, TLS, cookies, CORS, information disclosure, and OWASP mapping.
- Advanced — presents an extra Nuclei template tags picker with the tags
cve,misconfiguration,exposure,takeover,default-login,xss,sqli,lfi,rce, andssrf.
Advanced mode does not currently change what runs.
The scan endpoint accepts only a target and a mode, and the client does not send a mode, so every
scan is recorded as basic and the selected Nuclei tags are ignored.
Treat the Advanced control and the tag picker as having no effect on the check set until the
contract is fixed.
Reading the scorecard
The hero shows the letter grade returned by the scan and its score out of 100, together with a count for each severity level.
| Severity | Meaning in the report |
|---|---|
| critical | Highest ranked findings |
| high | |
| medium | |
| low | |
| info | Informational only; shown when the scan reports a count |
Category Scores breaks the overall score down per check. Categories the scan reports include:
| Key | Label |
|---|---|
headers | Headers |
tls | TLS |
cookies | Cookies |
cors | CORS |
info-disclosure | Info Disclosure |
Findings
The Findings table lists every check result.
| Column | Contents |
|---|---|
| Severity | critical, high, medium, low, or info |
| Check | The check that produced the finding |
| Title | A short description |
| OWASP | The mapped OWASP categories, written as standard:id, for example web:A01 |
| CWE | The mapped CWE identifier |
Filter chips narrow the table to a single severity, and a Failing only toggle hides passing rows. Passing rows are dimmed and sorted to the bottom.
Click a row to expand Description, Evidence, and Remediation for that finding.
OWASP coverage
The OWASP Coverage panel maps the current scan's findings onto one OWASP suite's categories. Each category is marked as failing, passing, or not assessed, with a count of the findings behind it, and a summary line reports how many categories were assessed and how many are failing.
Suites you can switch between on this panel: Web 2021, Web 2017, Web 2013, Web 2010, Web 2007, Web 2004, Web 2003, API 2023, API 2019, Mobile 2024, LLM 2025, and CI/CD 2022. Web 2021 is selected by default.
Executive summary
When the backend produces a summary for the scan it appears as an Executive Summary card with a grade tile, a headline, a narrative, a severity distribution bar, Top Risks, Quick Wins, and Weakest Areas. A badge marks whether the summary was produced by a provider or by rules.
History and trend
Scan history lists recent scans with their grade, target, score, and start time. Selecting a completed row loads that report. Rows for scans that are still running or that failed cannot be opened.
Security score trend charts up to the last twenty completed scans for the target currently on screen. With only one scan it says so instead of drawing a line.
Exports
Two buttons in the scorecard hero export the report:
- JSON — the whole report object.
- CSV — one row per finding, with severity, status, check, title, OWASP, CWE, and remediation.
Exports are available to anyone who can view the report.
OWASP Suites
A reference catalog of security frameworks, independent of any particular scan.
Three metric cards count the suites indexed, their total categories, and the distinct frameworks represented. Filter chips narrow the catalog to one framework:
| Chip | Section |
|---|---|
| Web | OWASP Web |
| API | OWASP API |
| Mobile | OWASP Mobile |
| LLM | OWASP LLM |
| CI-CD | OWASP CI/CD |
| CWE 25 | CWE Top 25 |
| Proactive | OWASP Proactive Controls |
| K8s | OWASP Kubernetes |
Each suite card shows its label, its standard and version, and how many categories it contains. Click View to load and list those categories, and Hide to collapse the card again.
Attack Surface
Maps the external footprint of a domain: subdomains from certificate-transparency logs plus DNS probing of common names, each then resolved.
- Enter a domain.
- Click Map surface.
The button reads Re-map after a successful run. Discovery is a single request with no progress reporting — the screen shows Mapping surface… until it returns.
Results are three stat cards — Domain, Hosts discovered, and Live (resolving) — followed by two lists:
- Live hosts — hosts that resolve, with their addresses. These are your real exposure.
- Historical / unresolved — names found in certificate transparency that no longer resolve, collapsed behind a toggle.
Each host carries a badge for where it was found: CT log for certificate transparency, DNS for the wordlist probe.
Attack surface results are not stored. They live only for as long as the tab is open, so there is no history to return to and nothing to export — re-run the discovery when you need it again.
Domain Explorer
Crawls a site and maps its pages, response times, and link structure.
- Enter a URL.
- Optionally open Advanced crawl settings to set:
- Max depth — how many link levels to follow, from 1 to 10, default 3.
- Max pages — where to stop, default 200, clamped between 10 and 10000.
- Click New Crawl.
Four metric cards summarize all sessions: Crawl Sessions, Pages Crawled, Avg Response, and Errors.
The session list refreshes itself while any crawl is running. Each session shows the host, its status, the start URL, and its page, error, and average-response counts. A running crawl can be cancelled; a finished one can be deleted.
Expanding a session offers two views:
- List — a sortable table of Status, URL, Title, Depth, and Response, capped at the first 300 pages.
- Graph — an interactive link graph where each node is a page colored by HTTP status class. Click a node to inspect its status code, URL, title, depth, response time, inbound link count, and whether it is internal or external.
Recurring security monitoring
Scheduled re-scans are not configured from this screen. They live on the Monitoring tab of Targets, which re-scans saved targets on an interval and raises an alert when a score drops.
