Reports
Device usage, reservation, and session analytics at /devicer/reports.
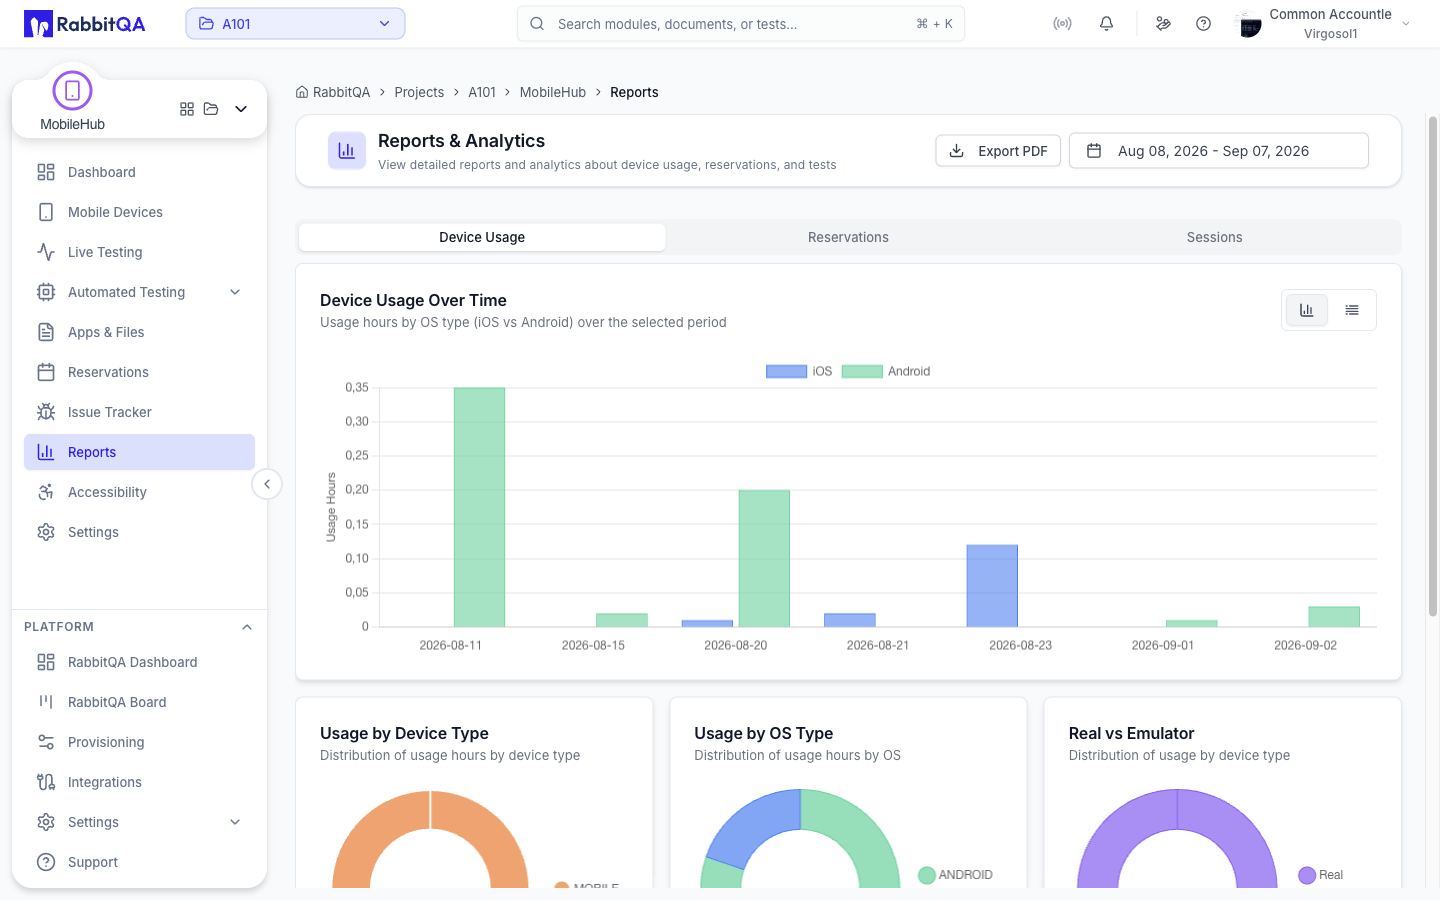
Date Range
A date range picker in the page header scopes every chart on every tab. Pick a start and an end date from the two-month calendar.
Export
Export PDF renders all three tabs and saves them as a single PDF named devicer-report-{date}.pdf.
The exported pages carry the selected reporting period in a banner, so the file is self-describing once it leaves the product.
Device Usage
| Section | Shows |
|---|---|
| Device Usage Over Time | Usage hours by OS type — iOS against Android — over the period |
| Usage by Device Type | Distribution of usage hours by device type |
| Usage by OS Type | Distribution of usage hours by operating system |
| Real vs Emulator | Distribution of usage between real devices and emulators |
| Top Used Devices | The devices with the highest usage hours |
The usage-over-time section can be switched between a chart and a table.
Reservations
| Section | Shows |
|---|---|
| Reservations Over Time | Reservation counts by status across the period |
| Status Distribution | The breakdown of reservations by status |
| Top Users | The users with the most reservations |
Sessions
| Section | Shows |
|---|---|
| Test Duration by Device Type | Average duration by device type |
| Test Status Distribution | Tests by status |
| Test Types | Live against automated tests |
| Automation Platforms | Tests by automation platform |
Scope
Report queries are scoped to mobile devices, so BrowserHub sessions do not appear here. Browser results are reported separately in that module.
