Live Testing
Interactive testing on real devices, emulators, and simulators, at /devicer/live-testing.
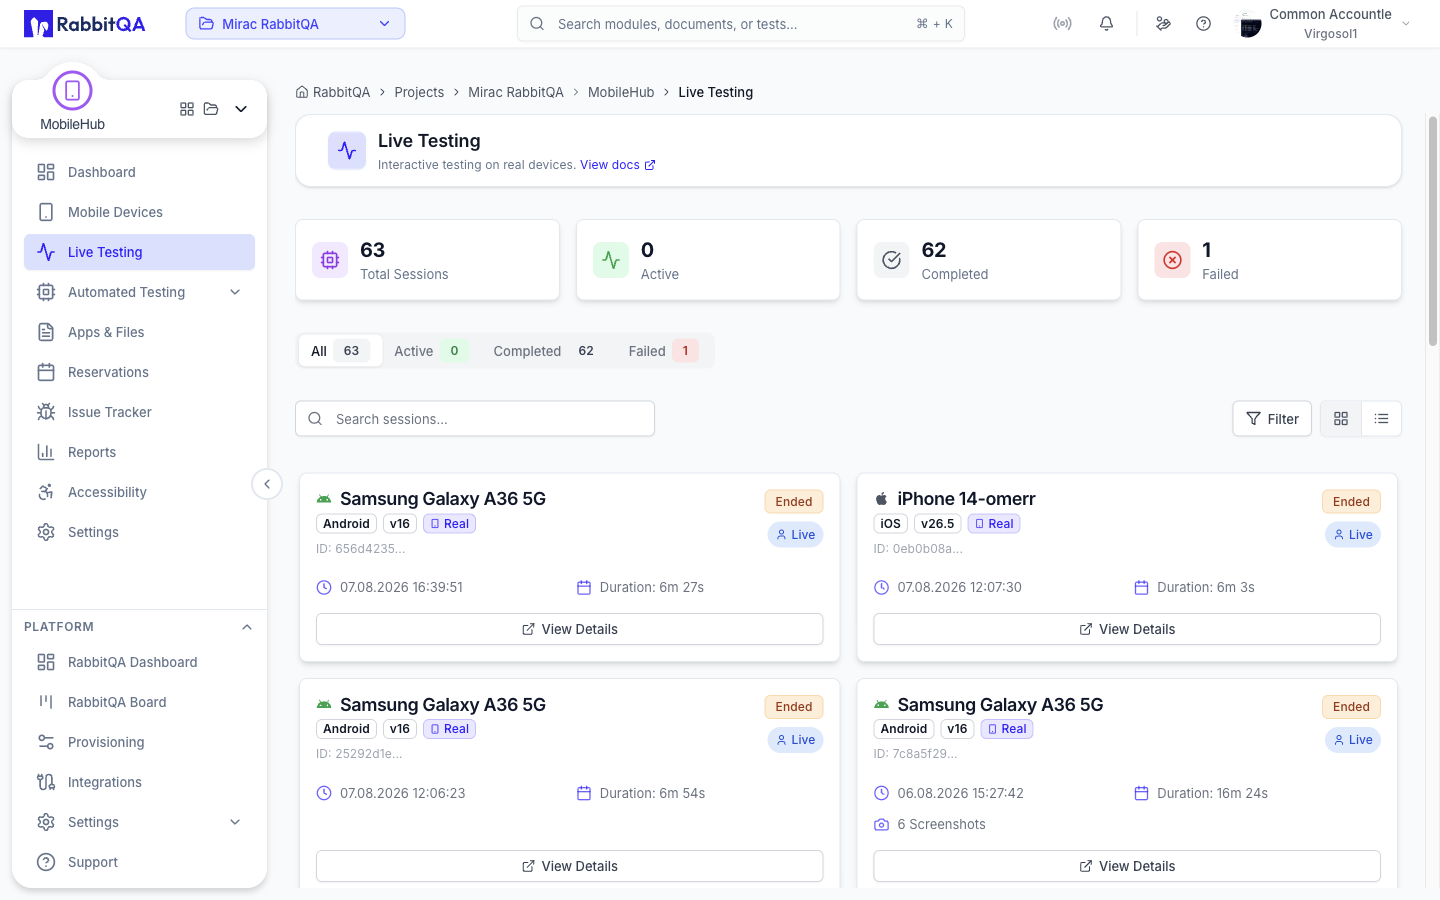
Session List
The Live Testing page lists interactive sessions. Four cards at the top give the totals: Total Sessions, Active, Completed, and Failed.
Tabs
| Tab | Shows |
|---|---|
| All | Every live session |
| Active | Sessions running right now |
| Completed | Sessions that ended normally |
| Failed | Sessions that ended in an error |
When you are on a tab other than Active and there are active sessions, a banner tells you so and links to them.
Search and Filters
Search matches session and device text. The filter menu offers multi-select Platform (iOS, Android) and Version filters, with a Clear all filters control.
You can switch between a card view and a table view.
Session Cards
Each card shows the device, a Live or Automated badge, the session status, the duration, and the last activity time. Screenshot and video counts are shown as shortcuts that open the corresponding artifact panel directly. View Details opens the session.
Without the "Start Sessions" permission you can still follow sessions from this page, but the controls that start or end one are withheld. Ask an administrator to grant the permission.
Session Detail Page
Opening a session takes you to /devicer/live-testing/{sessionId}.
While the device is being provisioned, a loading screen reports the real progress rather than a generic spinner:
| Stage | Meaning |
|---|---|
| Requesting device | The session request has been sent |
| Connecting to hub | Connecting to the hub that owns the device |
| Negotiating video stream | Setting up the video connection |
| Almost there | The stream has arrived and is being attached |
While the first stage is still running, the screen shows the milestone the agent last reported — Device reserved, Starting device driver, Starting screen mirroring, or Screen mirroring active — or Setting up secure connection while the network configuration is still loading. You can cancel from this screen.
Once the stream is up, see Device Control for the toolbar, gestures, and in-session tools.
Session Header
The header carries the session name, which you can rename in place, and an expandable device summary with the device name, alias, platform, version, model, and type. Badges show the session type and status. Add Device starts a second session and adds it to the parallel view.
Side Panels
The session toolbar opens one panel at a time next to the stream.
| Panel | Contents |
|---|---|
| Logs | Live device logs, with filtering, search, and download |
| Notes | A rich-text session notebook that saves as you type |
| Screenshots | Screenshots captured in this session, with preview, download, and delete |
| Recordings | Screen recordings, with playback and download |
| Files | Files pushed to or pulled from the device |
| Inspector | The UI element tree, element properties, and locator tools |
| Metrics | Live device metrics |
| App Toolkit | Instrumentation hooks for an instrumented build |
| Developer Tools | Debug access, IDE and CLI commands, and web debugging targets |
The toolbar also has a Report Bug button. Tests and Activities buttons appear on automation sessions only — see Automated Testing.
Keyboard Shortcuts
The toolbar's shortcut dialog lists the panel shortcuts.
Use Alt on Windows and Linux, Option on macOS.
| Shortcut | Panel |
|---|---|
Alt + L | Logs |
Alt + S | Screenshots |
Alt + R | Recordings |
Alt + F | Files |
Escape closes the open panel, and in parallel view closes the inspector first and then leaves parallel view.
In parallel view, Ctrl or Cmd with 1, 2, or 3 focuses that device.
Shortcuts are ignored while you are typing in a text field.
Parallel View
Select up to three sessions to view side by side. Each device keeps its own controls, and the focused device drives the inspector panel. Use Add Device in the header to start another session without leaving the view.
Notes
The Notes panel is a rich-text editor scoped to the session. It saves automatically and shows the time of the last save. You can capture the current screen into the notes, or insert a screenshot taken during a test step.
Activities
Every action performed during the session is recorded in an activity timeline. Selecting an activity opens a detail drawer with:
- The action type, status, duration, and timestamp.
- The screenshot captured with the activity, when there is one.
- Request details for network activities: method, path, status code, request and response size, and timeout.
- Locator details for element activities: strategy, selector value, and element ID.
- The error message, when the activity failed.
Ending a Session
End Test asks how the test went before the device is released.
| Result | Meaning |
|---|---|
| Passed | The test succeeded |
| Failed | The test did not succeed |
| No Result | End without recording a verdict |
You can add an optional note or reason. Once a result is selected, End & Report Bug ends the session and opens the bug report form with the session's artifacts attached. See Issue Tracker.
Ended Sessions
An ended session keeps its artifacts and opens with tabs instead of live panels.
| Tab | Contents |
|---|---|
| Overview | Session, user, device, and automation details, plus recent activities |
| Logs | The captured device logs |
| Screenshots | Every screenshot from the session |
| Recordings | Every recording from the session |
| Files | Files transferred during the session |
| Metrics | Device metrics recorded during the session |
| Accessibility | Accessibility reports saved from this session |
| Notes | The session notebook |
| Test Results | Test events, for automation sessions |
Cross-Module Active Work
The Active Work control in the platform header opens a drawer listing in-progress sessions, runs, and jobs across every module, MobileHub included. Filter it by module, or narrow it to the last hour, three hours, six hours, day, three days, or all time.
