Observability
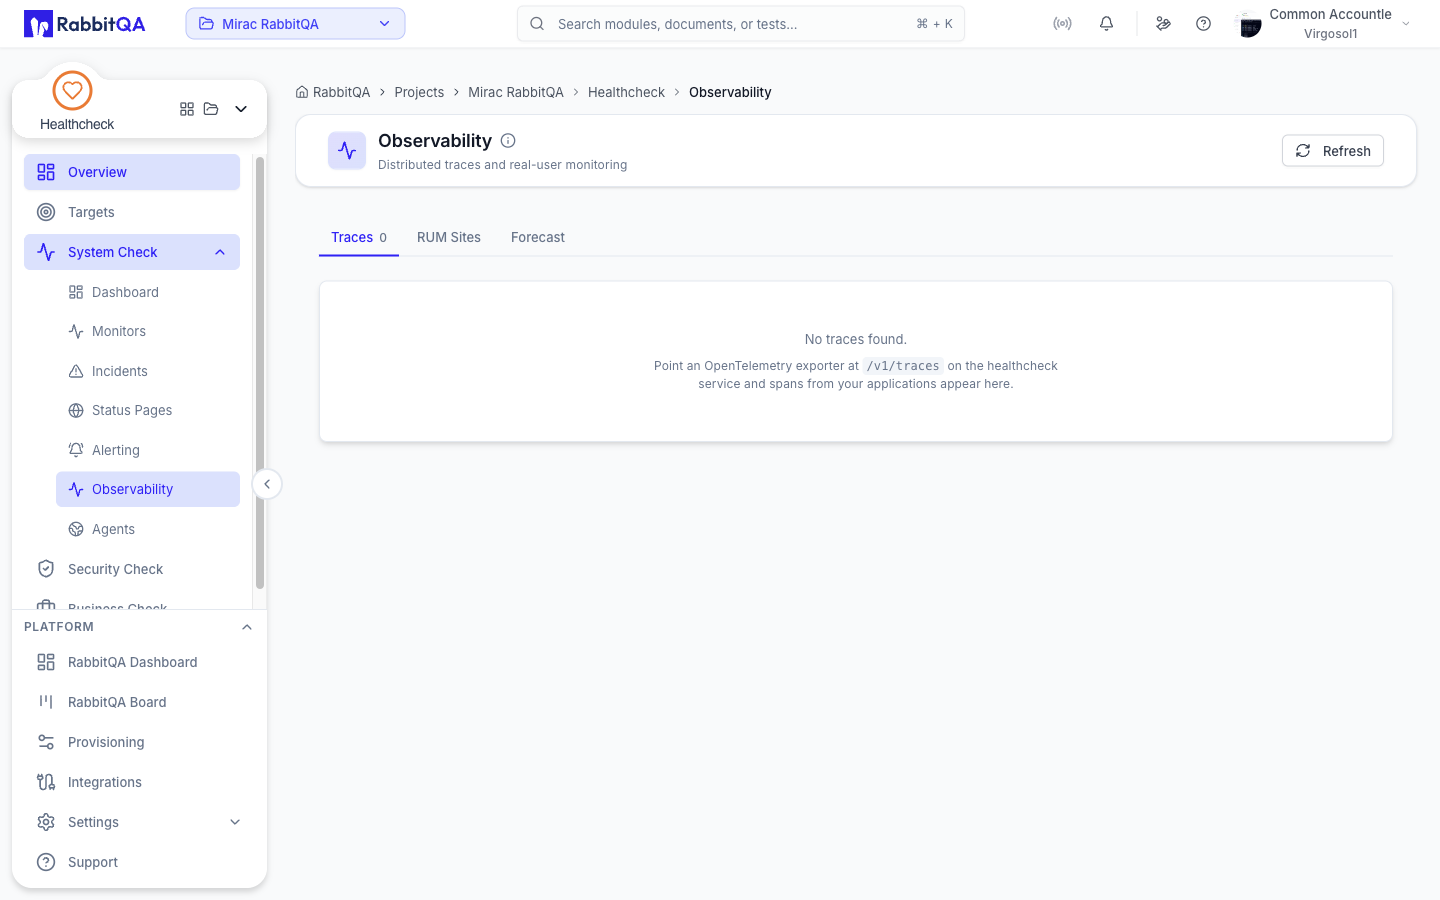
Observability at /healthcheck/observability looks at your applications from the inside, where
monitors only see the outside.
It has three tabs.
| Tab | What it shows |
|---|---|
| Traces | Spans your applications export |
| RUM Sites | Sites registered for real-user monitoring |
| Forecast | A projected response time for one monitor |
Traces
A read-only table of recently received traces.
| Column | Contents |
|---|---|
| Status | OK or SUCCESS, ERROR or FAILED, or the raw value |
| Service | The reporting service |
| Root span | The trace's root operation |
| Duration | How long the trace took |
| Spans | Number of spans in the trace |
| Errors | Number of errored spans |
| When | When it arrived |
Traces are not created here.
Point an OpenTelemetry exporter at /v1/traces on the HealthCheck service and spans from your
applications appear in this table.
There is no per-trace drill-down or span waterfall in this release.
RUM Sites
A RUM site collects timings from real visitors to your pages.
Registering a site
Click New site and fill in:
| Field | Notes |
|---|---|
| Name | For example Acme marketing site |
| Site id | Generated from the name. It becomes part of the snippet URL and cannot be changed afterwards |
| Domains | Comma separated, for example acme.com, www.acme.com |
Click Create.
Embedding the snippet
Each site card carries a script tag with a Copy button. Add it to the pages you want measured.
Sites can be deleted but not edited — recreate one to change its domains.
This tab registers sites and hands out the snippet. There is no screen that displays collected real-user metrics in this release.
Forecast
Projects a monitor's response time forward from its recent history.
Pick a monitor from the selector. Three cards summarize the projection:
| Card | Meaning |
|---|---|
| Current avg | The monitor's current average response time |
| Trend / day | The daily change, labeled improving or worsening |
| Horizon | The number of days the forecast covers |
Predicted response time charts the projection. The shaded area is the upper confidence bound, and the projection is a linear trend over the forecast window.
There is nothing to create on this tab.
