Monitors
A monitor is one thing you want checked, on a schedule, from somewhere.
The Monitors screen at /healthcheck/monitors lists them all.
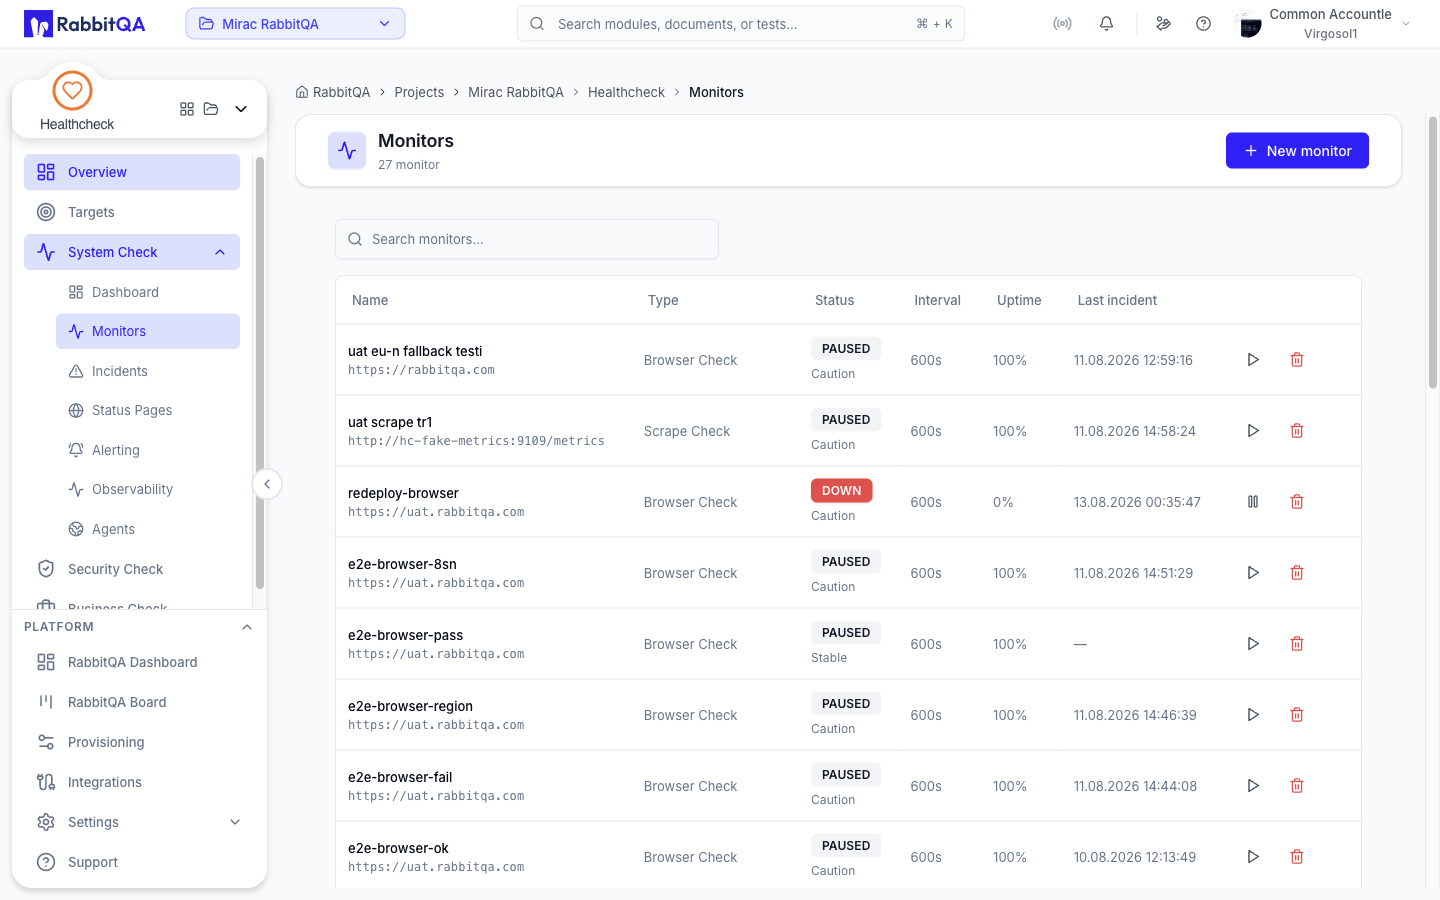
The monitor list
| Column | Contents |
|---|---|
| Name | The monitor name, with its target underneath |
| Type | The check type |
| Status | UP, DOWN, or PAUSED |
| Interval | How often the check runs |
| Uptime | Uptime for the monitor |
| Last incident | When it last failed |
Search narrows the list by name. Each row can be paused, resumed, or deleted; pausing stops the schedule without deleting the history.
Click Add monitor to open the new-monitor form.
Check types
Thirteen check types are available.
| Type | What it checks |
|---|---|
| HTTP Check | An HTTP or HTTPS endpoint's response |
| Keyword Check | An HTTP response body for a keyword |
| Ping Check | ICMP reachability of a host or IP |
| Port Check | Whether a TCP port accepts a connection |
| DNS Record Check | That a DNS record resolves, optionally to an expected value |
| SSL Certificate Check | Certificate validity and time to expiry |
| Heartbeat Check | That something external checks in on time |
| UDP Check | A UDP service, optionally requiring a reply |
| SMTP Check | A mail host, taken through EHLO |
| Metric Check | Numbers you push, against thresholds you define |
| SQL Check | A PostgreSQL or MySQL database, by running a query |
| Browser Check | A page loaded in a real Chromium browser |
| Scrape Check | A metrics endpoint read by an agent, whose values come back as series |
Creating a monitor
The form is one page, grouped into cards.
Basics
| Field | Notes |
|---|---|
| Name | Required |
| Type | One of the thirteen check types above |
| Interval (seconds) | Minimum 30, default 180. Your plan may enforce a longer minimum |
| Run from | A shared region, or one of your own active private agents |
Run from is hidden for a Metric Check, because nothing is probed — you push to it instead.
The target
The second card changes with the type.
| Type | Fields |
|---|---|
| Port, UDP, SMTP | Host, Port |
| UDP | plus Payload and Require a reply |
| SMTP | plus Security — None (plain), STARTTLS, or TLS (implicit) |
| SQL | Host, Port, and the connection fields for the chosen engine |
| Ping | Host or IP |
| DNS | Domain, Record type (A, AAAA, CNAME, MX, TXT, NS), Expected value |
| SSL | Domain, Warn when the certificate expires within (days), and checkboxes for Certificate expiry reminders and Domain expiry reminders |
| Heartbeat | Expected heartbeat interval (seconds) |
| Metric | Report down after (minutes without a push) — 0 disables the staleness rule |
| Browser | An optional keyword and a Recording length |
| Everything else | URL |
A UDP payload can be written as text or as Base64 when the probe needs to be binary. A SQL Check runs against PostgreSQL or MySQL.
The request (HTTP and Keyword)
| Field | Notes |
|---|---|
| Method | GET, POST, PUT, PATCH, DELETE, HEAD, OPTIONS |
| Healthy status codes | Comma separated, for example 200, 201 |
| Follow redirects | On by default |
| Fail on TLS errors | On by default |
| Keyword and Case sensitive | Keyword Check only |
| Headers | Any number of header and value pairs |
| Request body | Free text |
| Auth | None, Basic with a user and password, or Bearer token |
Assertions
Extra conditions the check must satisfy, on top of the type's own pass criteria.
Each assertion is a criteria, a condition, and an expected value. The available criteria depend on the monitor type — some types have none, and the form says so.
Notifications
Tick the notification methods that should receive alerts for this monitor. The list is a fixed set of nine: Email, Sms, Jira, Discord, Slack, PagerDuty, Teams, Telegram, and Webhook.
All nine are tickable, but only Slack and Teams can actually be connected in the interface — see Alerting. Ticking any of the others records the choice against a provider you have no way to connect, so nothing is delivered through it. For alerts that need to arrive today, use Email recipients below, or connect Slack or Teams.
Email recipients takes a comma-separated list of addresses. Leaving it empty falls back to the system mailbox.
Where checks run
Most checks can execute centrally; Browser Check and Scrape Check cannot. Port, ping, UDP, SMTP, SQL, Scrape, and Browser jobs can also be placed on an enrolled agent.
If you request a region and no compatible runner is live there, the check can fall back to another shared runner, and most types then degrade to running centrally.
Browser Check and Scrape Check are the two exceptions. Neither can run centrally, so when no runner answers they are recorded as a failed check rather than degrading — No browser runner available in this region and No runner available in this region to scrape the endpoint. A Browser Check additionally needs a runner that advertises browser capability.
Browser Check
A Browser Check loads the page in a real Chromium browser, so client-side content counts.
- An optional keyword is matched against the rendered page. Leave it empty to require only that the page loads.
- Recording length is the number of seconds the browser stays on the page after load, which is also the length of the recording. It also gives client-side content time to appear before the keyword is checked, and adds to how long each check takes.
- Every run is recorded, but only failed runs keep their recording. You will find it on the incident — see Incidents.
Recordings are stored with a retention window and deleted on a daily schedule. The default window is 14 days.
Pushed checks
Two check types wait for you to send data rather than probing anything.
Heartbeat Check
For a cron job or background worker that should check in. Set the Expected heartbeat interval, and the monitor goes down when no heartbeat arrives inside that window.
Send a heartbeat with:
POST /healthcheck/api/v1/heartbeat/{token}
Metric Check
For numbers your own system produces. Create the monitor, collect its push token, and post your values.
POST /healthcheck/api/v1/metrics/{token}
Thresholds decide when an incident opens. Each threshold is a metric name, an operator, and a value:
| Operator | Meaning |
|---|---|
GT | is above |
GTE | is at or above |
LT | is below |
LTE | is at or below |
EQ | equals |
NEQ | does not equal |
Set Report down after to have the monitor go down when no push arrives for that many minutes, or leave it at 0 for metrics reported on an irregular schedule.
Both push endpoints are public: they do not require a RabbitQA session, and the token in the path is the credential. Treat a heartbeat or metric token like a secret.
