Data Sessions
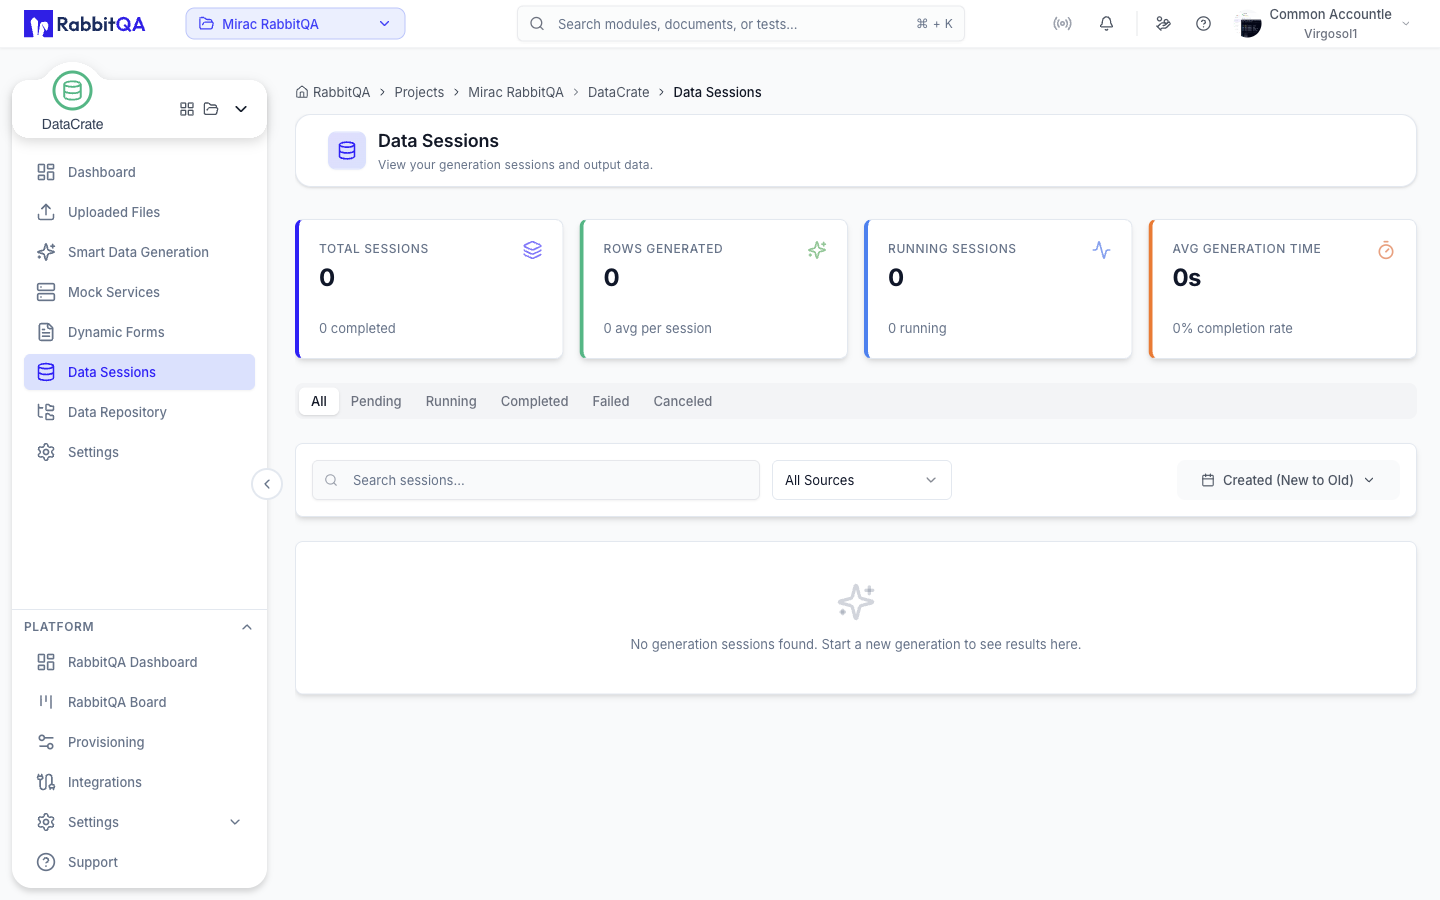
Every generation run becomes a session. Data Sessions is where you watch runs in progress and go back over the ones that finished.
Session List
Four metric cards head the page: Total Sessions, Rows Generated, Running Sessions, and Avg Generation Time with a completion rate.
Sessions are grouped into status tabs, each showing a count.
| Status | Meaning |
|---|---|
| Pending | Queued, not started yet |
| Running | Currently generating |
| Completed | Finished successfully |
| Failed | Stopped with an error |
| Canceled | Stopped by a user |
A run that finished but did not pass validation is shown as Quality gate failed.
Filters
| Filter | Options |
|---|---|
| Search | Matches session names and codes |
| Source Type | All Sources, Mock Services, or Smart Data |
| API Format | OpenAPI, WSDL, Postman Collection, or gRPC Proto, when Mock Services is selected |
| Generation source | Generated schema or Dataset, when Smart Data is selected |
| Sort | Created or updated date, newest or oldest first |
Filters are kept in the page URL, so a filtered view can be bookmarked or shared. The list loads more sessions as you scroll, and refreshes on its own while any run is still going.
Session Cards
Each card shows the dataset name, the session code, rows generated, start time, the generation mode, the source, and the current status.
| Action | Availability |
|---|---|
| Open | Always |
| Cancel | While the run is pending or running |
| Delete | With the run delete permission |
Session Detail
Opening a session shows everything recorded about that run. While the run is active, the page refreshes on its own and stops once the run reaches a final state.
Context and Configuration
Source, generation mode, target rows, who ran it, the destination folder, source type, and the AI model used. Service generation runs show the mock service name and status in place of the folder and target rows.
Actions
| Action | Description |
|---|---|
| Save these generation details | Stores the run's configuration for reuse in Smart Data Generation |
| Load Config | Starts a new run with the same configuration |
| Preview | Opens the generated data. While the run is going, this is a live preview that keeps refreshing |
| Download | Saves the output artifact |
| Download Excel | For completed runs that produced a database artifact, exports one worksheet per table |
Load Config shows the output file, folder, and target rows it will use, then creates and submits the new run and opens it.
Cancel appears in the header while a run is pending or running. Retry appears in the header after a failure.
Run Progress
While a run is active, a progress bar and a phase message describe what is happening. Service generation runs report rows acquired against the target instead.
Service Request
Service generation sessions include the protocol, method, response path, and endpoint that were called.
Output File
The artifact produced by the run. Selecting it opens a preview.
For Smart Data runs, .csv, .tsv, .xlsx, .json, .jsonl, .ndjson, .parquet, and SQLite database output opens in an editor; other output opens read-only.
Linked Mock Services
Any mock services built from the same dataset or schema as this session, with their endpoint counts.
Related Pages
- Smart Data Generation — configure and start runs
- Data Repository — browse every artifact these runs produced
