DataCrate Dashboard
The dashboard is the landing page of the module. It answers three questions at a glance: how much data you have, what has run recently, and where to go next.
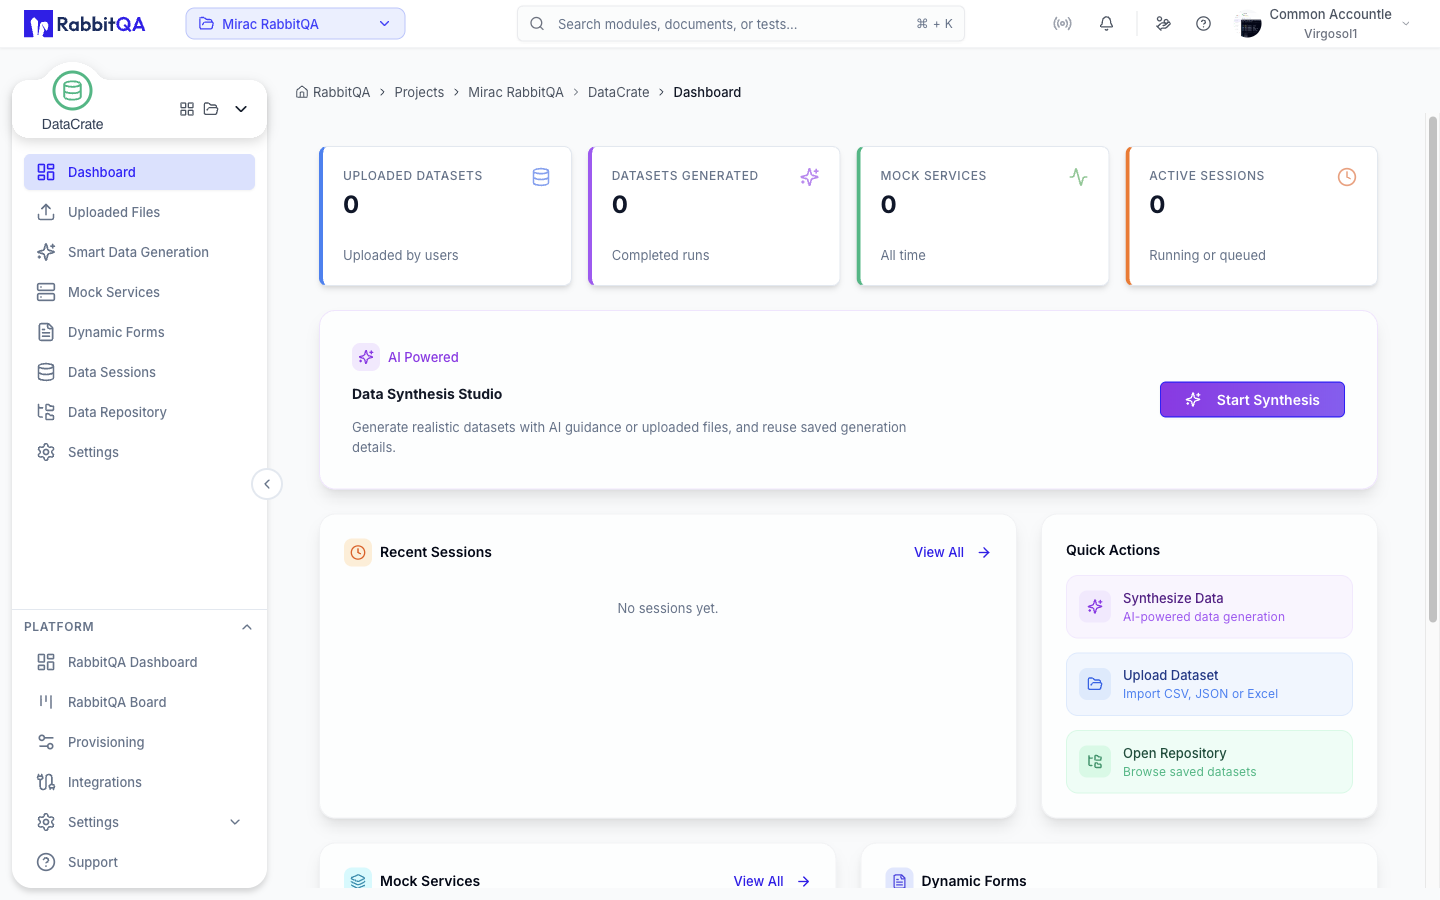
Metric Cards
Four cards run across the top of the page.
| Card | Counts |
|---|---|
| Uploaded Datasets | Datasets uploaded by users |
| Datasets Generated | Generation runs that have reached a final state |
| Mock Services | Mock services defined in the workspace, all time |
| Active Sessions | Generation runs currently running or queued |
Hovering the icon on each card shows a short explanation of what the number covers.
Data Synthesis Studio
The hero card below the metrics is the main entry point into generation.
Start Synthesis opens Smart Data Generation on the dataset generation tab, ready to build a table from AI guidance, an uploaded file, or generation details saved from an earlier session.
Recent Sessions
The five most recent generation runs, newest first. Each row shows the dataset name, the row count, the timestamp, and a status badge:
| Status | Meaning |
|---|---|
| Pending | Queued, not started yet |
| Running | Currently generating |
| Completed | Finished successfully |
| Failed | Stopped with an error |
| Cancelled | Stopped by a user |
| Quality gate failed | Finished but did not pass validation |
Select a row to open that session, or View All to open Data Sessions.
Quick Actions
Three shortcuts to the most common starting points:
- Synthesize Data — opens Smart Data Generation
- Upload Dataset — opens Uploaded Files
- Open Repository — opens the Data Repository
Mocks and Forms
Two cards sit side by side near the bottom of the page.
- Mock Services lists the three most recently created services with their route count and source, and links to Mock Services.
- Dynamic Forms shows how many form schemas are saved and links to Dynamic Forms.
Top Datasets
The five largest datasets by row count, each with its file type and row total. View All opens Uploaded Files.
Guided Tour
The dashboard ships with a short coach-mark tour covering the metric cards, the synthesis studio, recent sessions, quick actions, the mocks and forms cards, and top datasets. It starts automatically the first time you visit, after the module sidebar tour has been completed or skipped.
