Reports
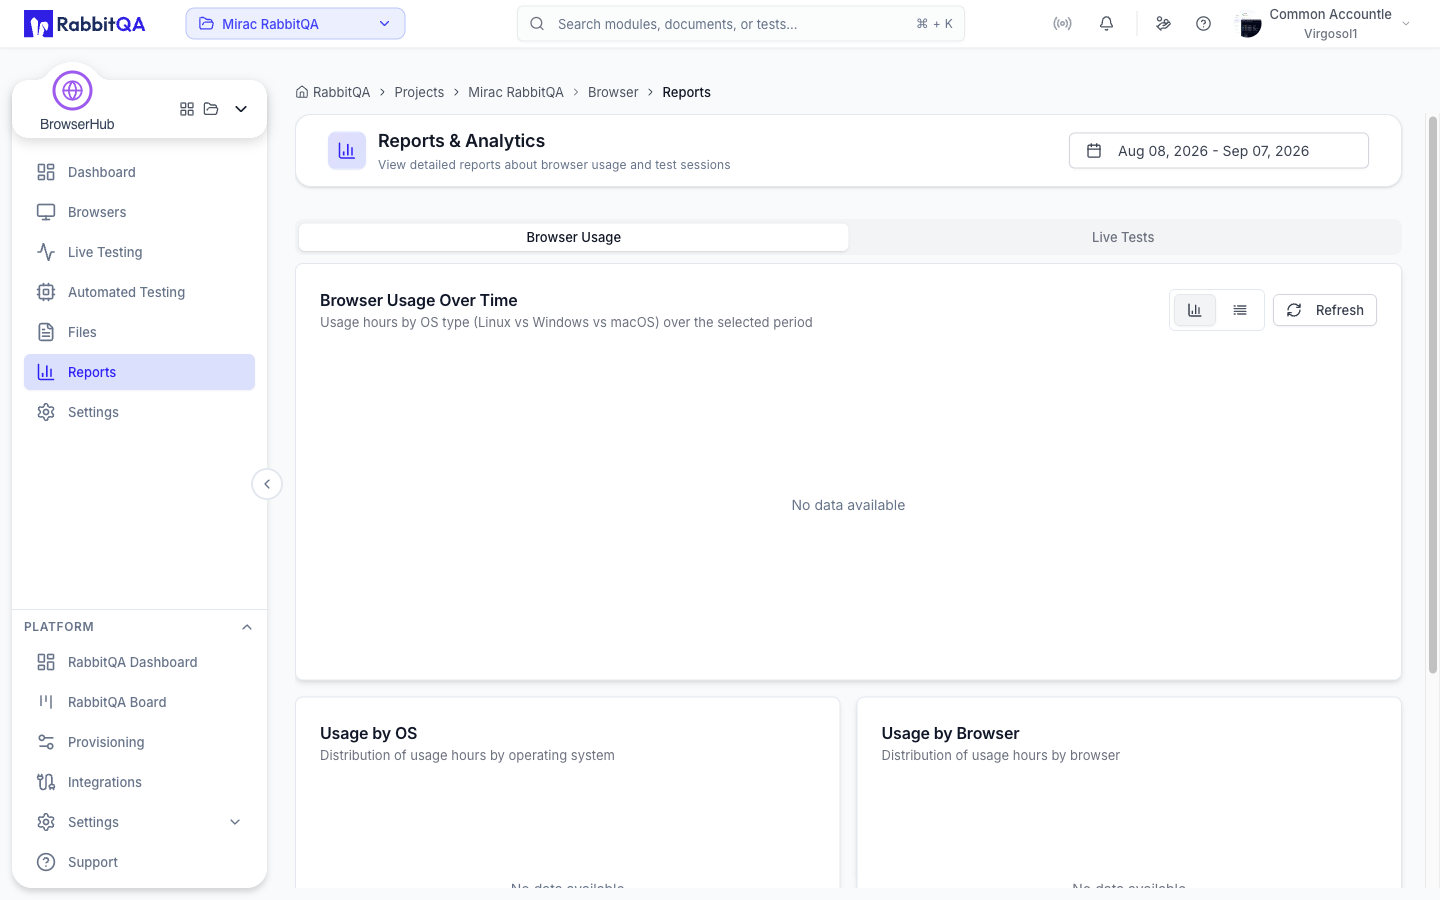
Reports and analytics at /browser/reports.
The charts are the MobileHub report components, filtered to browser resources, so nothing from the mobile fleet appears here. See MobileHub for the shared chart and export behavior.
Date Range
A date range picker in the page header scopes every chart on the page. Changing it reloads both tabs.
Browser Usage
| Panel | Shows |
|---|---|
| Browser Usage Over Time | Usage across the selected period, as a chart or as a table |
| Usage by OS | The share of usage per operating system |
| Usage by Browser | The share of usage per browser |
| Top Used Browsers | The most used browsers in the period |
The usage chart can be switched between chart and table views.
Live Tests
| Panel | Shows |
|---|---|
| Test Duration by Device Type | Session duration across the period |
| Test Status Distribution | How sessions ended |
| Test Types | The split between session types |
| Automation Platforms | The automation clients seen in the period |
Differences From MobileHub
BrowserHub reports have no reservations tab, because browsers are allocated on demand rather than reserved.
