Dashboard
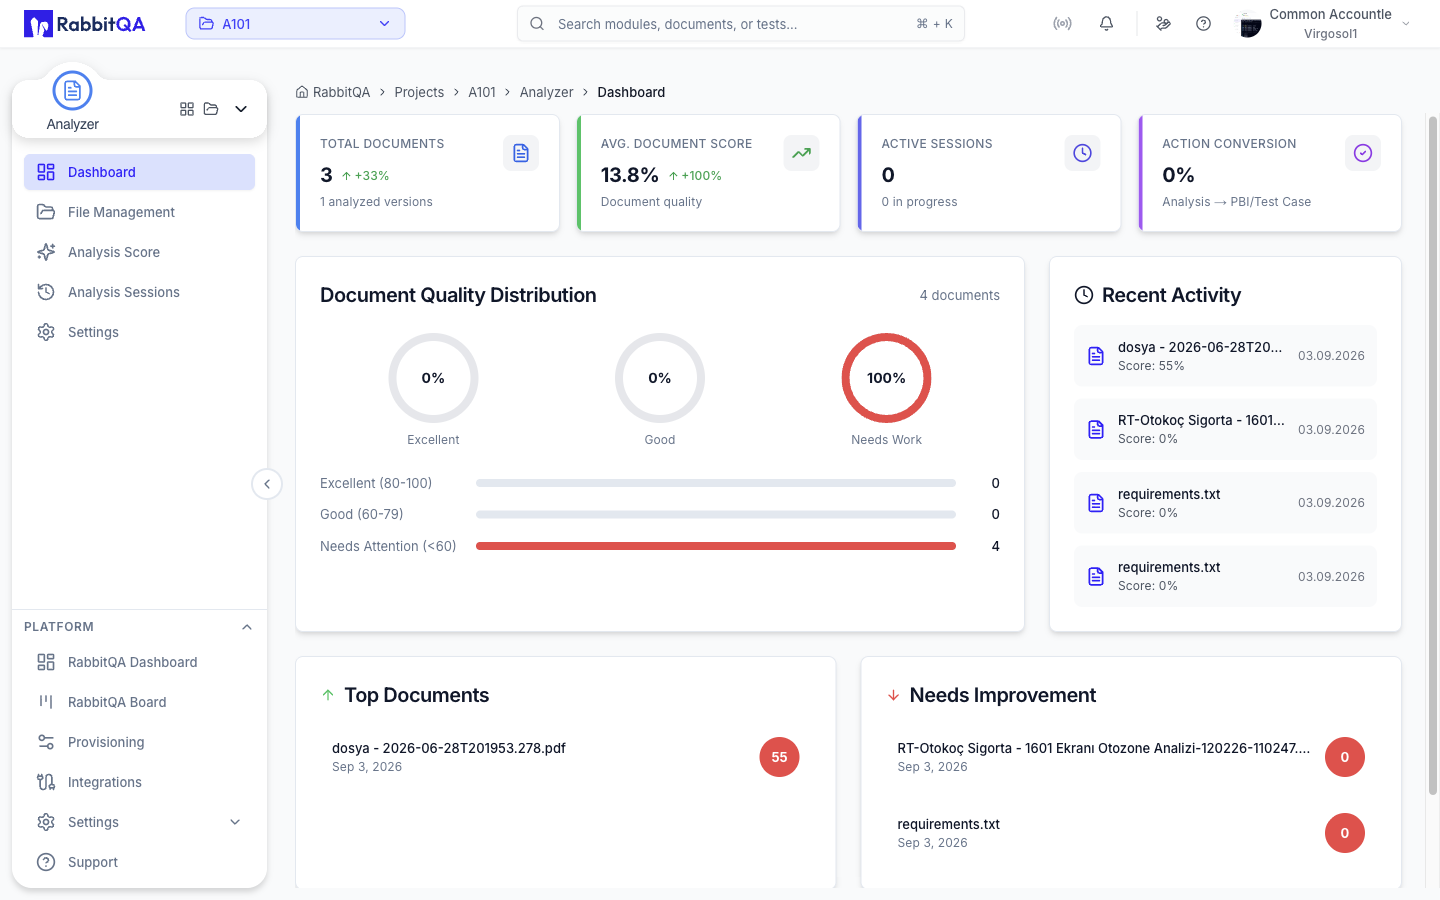
The dashboard is the module's landing page.
Opening /analyzer takes you straight here.
Metric cards
Four cards sit across the top of the page.
| Card | Value | Subtitle |
|---|---|---|
| Total Documents | Number of documents in the workspace | Analyzed version count |
| Avg. Document Score | Average score across analyzed versions | Document quality |
| Active Sessions | Analysis sessions currently active | How many are in progress |
| Action Conversion | Generated PBIs as a share of analyzed versions | Analysis → PBI/Test Case |
Total Documents, Avg. Document Score, and Action Conversion show a trend arrow against the previous period: green with an up arrow for an increase, red with a down arrow for a decrease. Active Sessions carries no trend.
Document Quality Distribution
Three gauges show the share of analyzed documents in each quality band, backed by a bar for each band with its document count.
| Band | Score range |
|---|---|
| Excellent | 80-100 |
| Good | 60-79 |
| Needs Attention | Below 60 |
The card header shows how many analyzed documents the distribution covers.
Recent Activity
Lists the four most recent completed activities.
| Activity type | What the row shows | Where clicking it goes |
|---|---|---|
| Analysis | Document name and Score: n% | The file detail page, opened on its Analysis Results tab |
| PBI generation | Document name and n PBIs generated | The matching Smart PBI session |
When there is no activity yet, the card offers an Analyze Document button instead. The button appears only for users who can start an analysis.
Top Documents and Needs Improvement
Two cards list the three highest and three lowest scoring documents, each with a colored score badge.
| Badge color | Score |
|---|---|
| Green | 80 and above |
| Yellow | 60-79 |
| Red | Below 60 |
Each row shows the date the version was scored, and clicking it opens that version on the file detail page.
Unanalyzed documents banner
When documents exist that have never been analyzed, an amber banner appears at the bottom of the page with the count and a Start Analysis button.
The button opens Analysis Score and is shown only to users with analyzer:analysis:create.
Live data
The quality and session figures refresh on their own while the page is open, so a running analysis updates the cards without a reload.
A guided tour walks through the metric cards, quality distribution, recent activity, and the top and bottom document lists the first time you open the page.
