Reports & Analytics
Generate reports and analyze test execution results.
Generate Reports
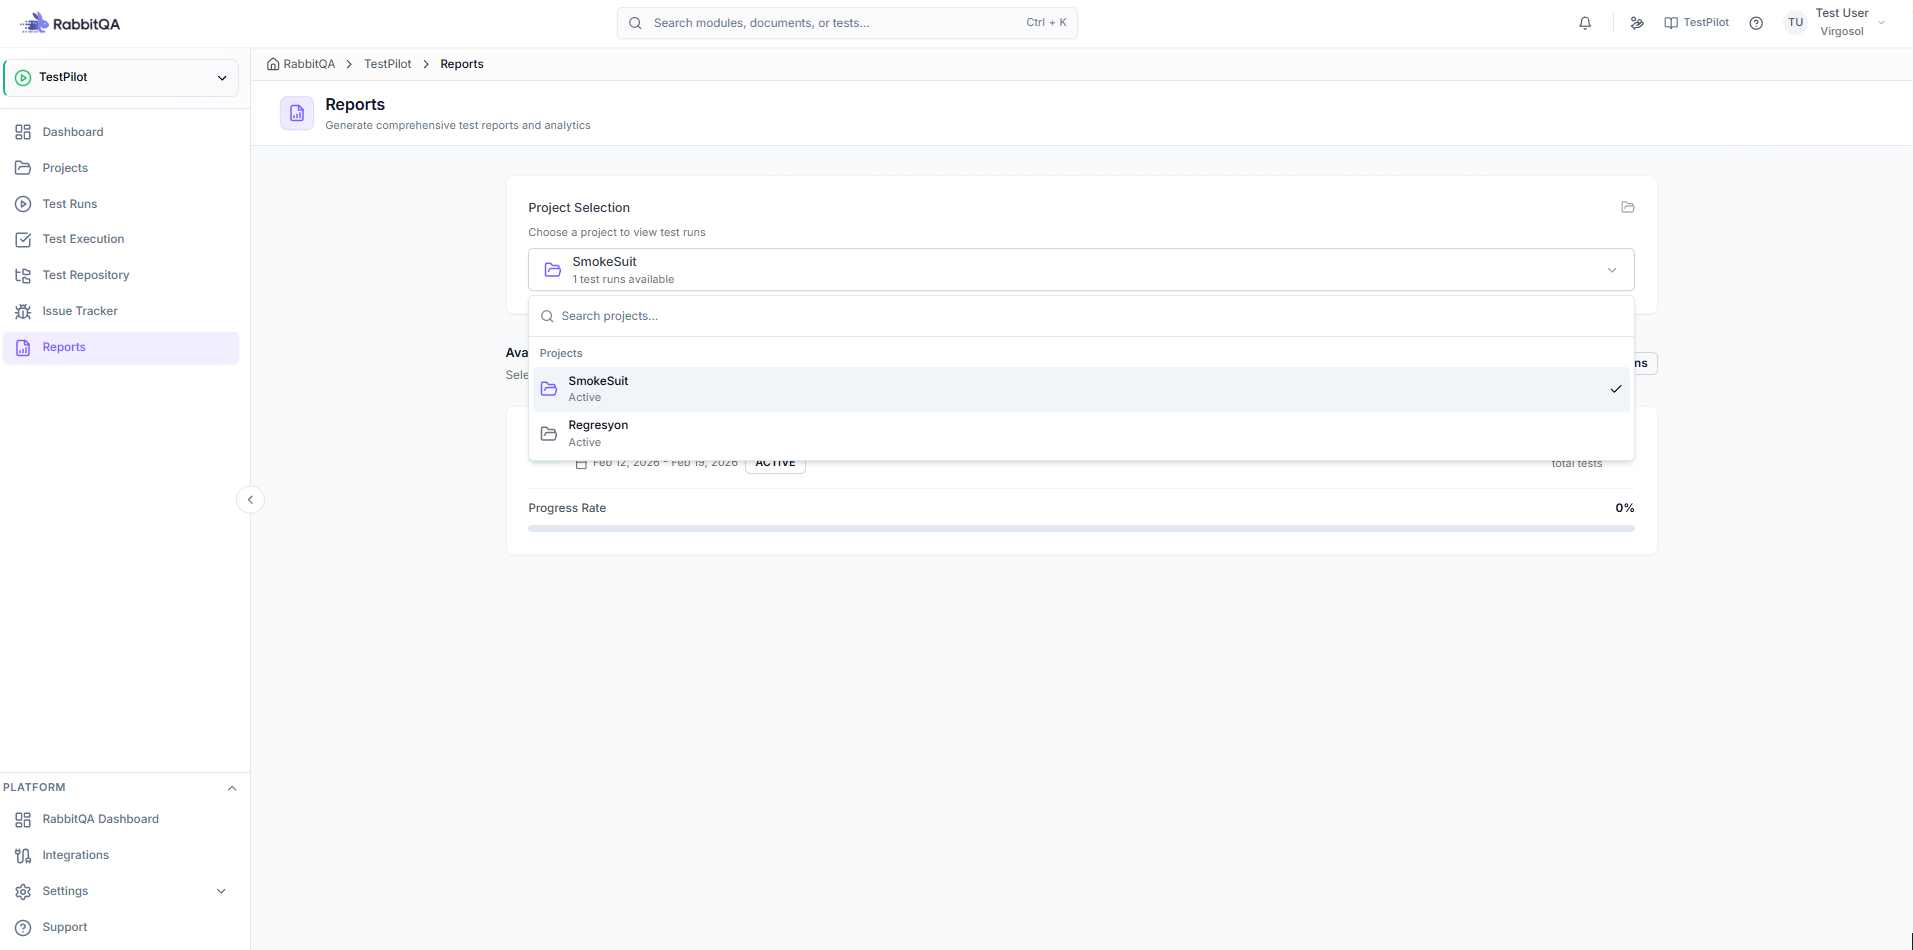
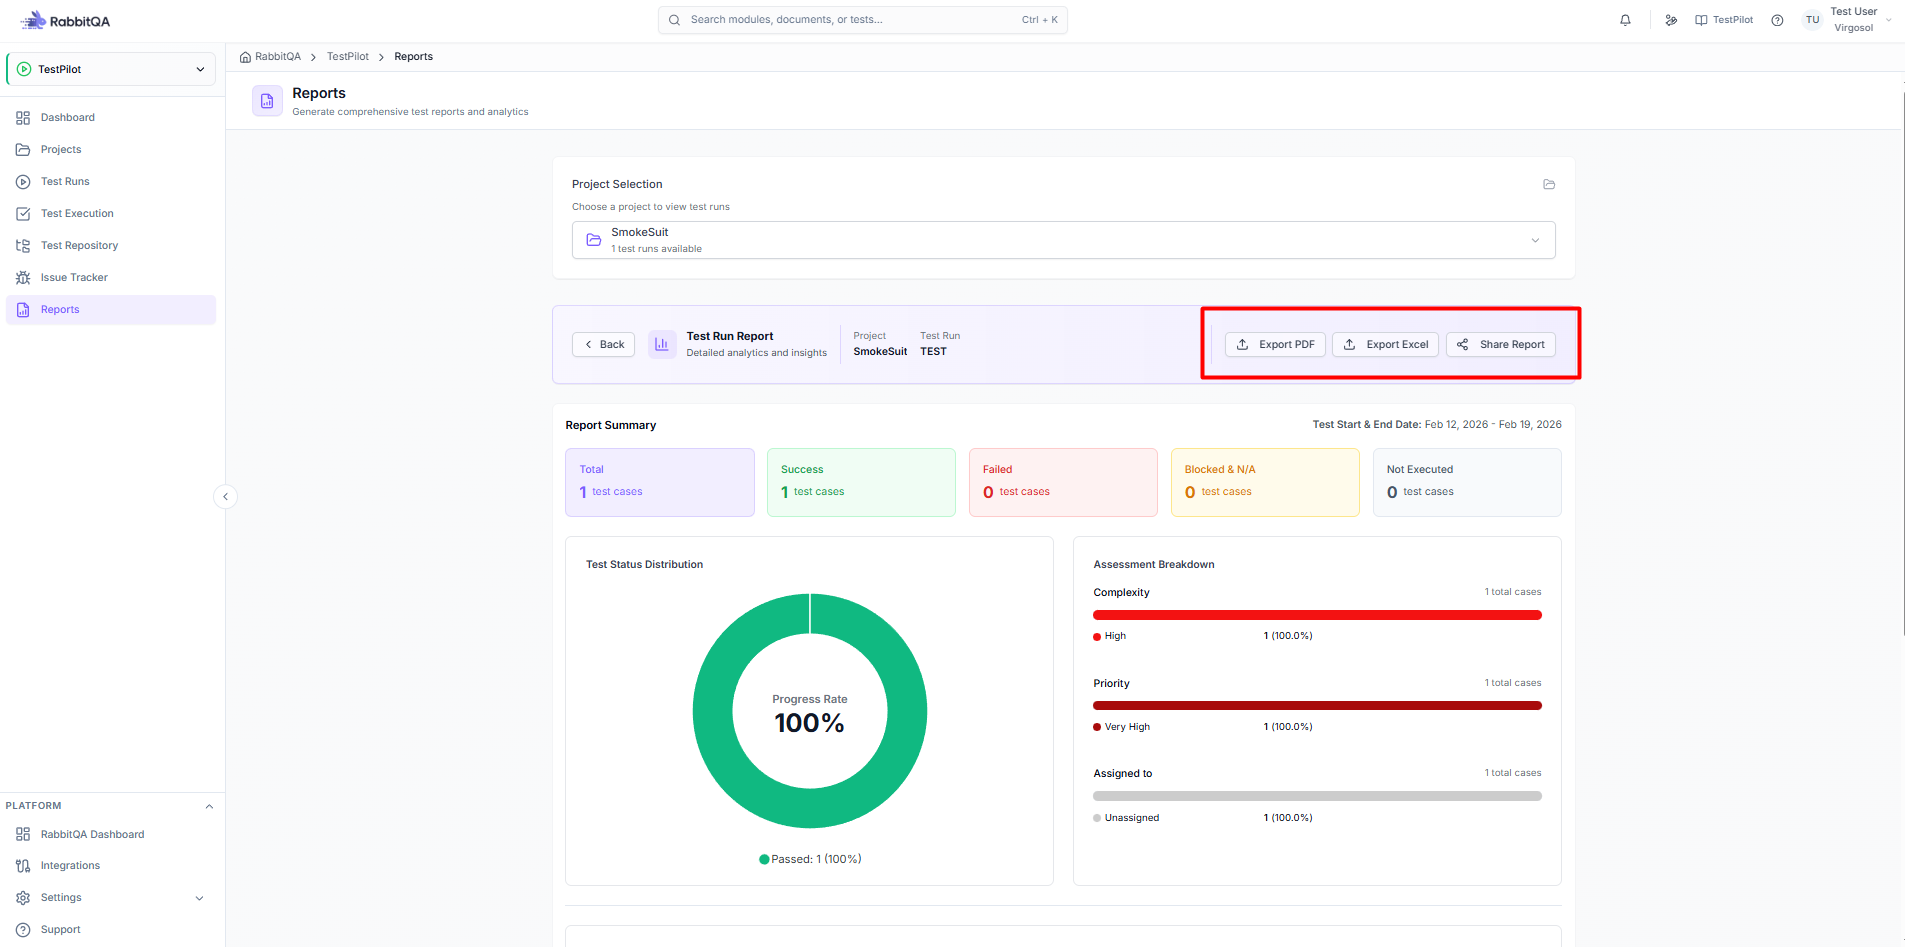
Access from the TestPilot module and navigate to the Reports page. Select the project and test run you want to report on. Choose the report type and export format. The report will include test results, metrics, and charts.
Report Generation Steps
- Navigate to TestPilot > Reports
- Select project from dropdown
- Select test run (or "All" for project-wide)
- Choose report type
- Configure report options
- Generate report
- Export to PDF or Excel
- Share with stakeholders
Report Types
Execution Report
Summary of test execution:
- Total tests executed
- Pass/Fail/Blocked counts
- Execution time
- Defects found
Coverage Report
Requirements coverage analysis:
- Requirements with tests
- Coverage percentage
- Gaps identified
Trend Report
Quality trends over time:
- Pass rate trends
- Defect discovery rate
- Velocity metrics
Executive Summary
High-level overview for stakeholders:
Test Execution Summary
----------------------
Total Tests:     100
Passed:          85 (85%)
Failed:          10 (10%)
Blocked:          5 (5%)

Quality Score: 85%
Detailed Results
| Test Case | Status | Duration | Notes |
|---|---|---|---|
| TC-001 | Pass | 2m 30s | - |
| TC-002 | Fail | 5m 15s | Bug found |
| TC-003 | Blocked | - | API down |
Defect Summary
Defects discovered during testing:
| ID | Title | Severity | Status |
|---|---|---|---|
| BUG-101 | Login fails | High | Open |
| BUG-102 | Slow response | Medium | Fixed |
Dashboard
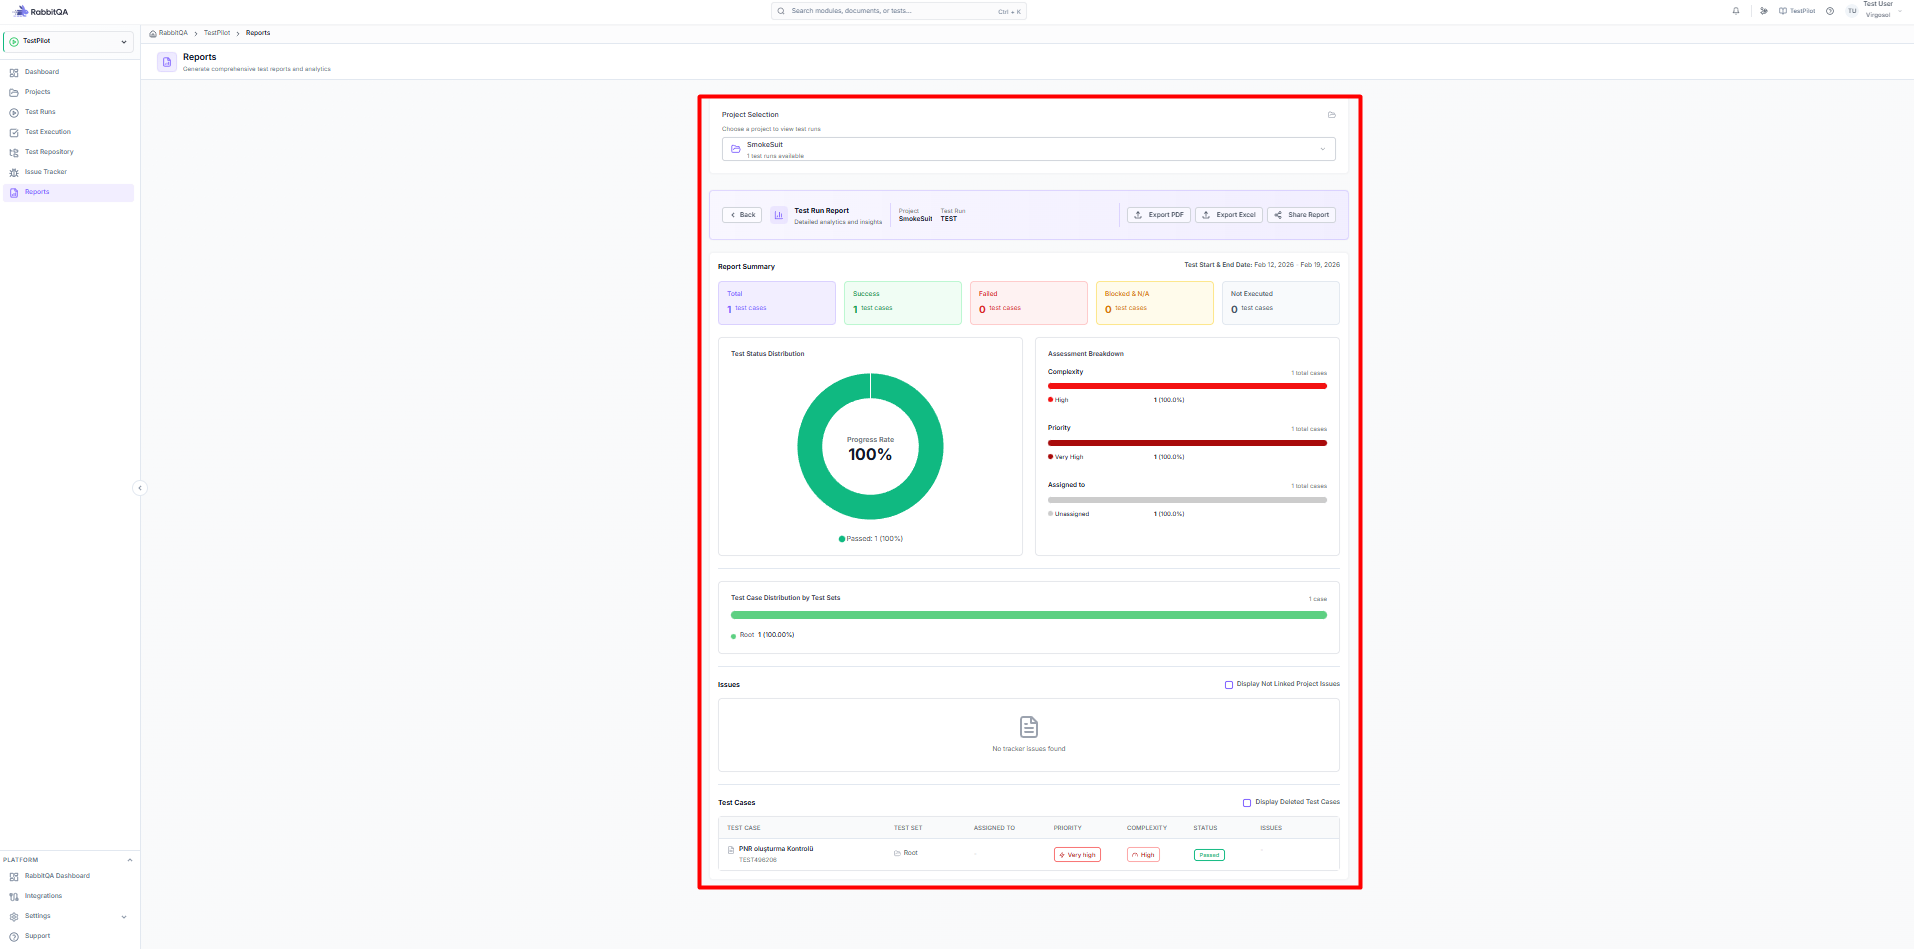
View the TestPilot Dashboard to monitor test execution activities in real-time. The dashboard displays key metrics including total projects, active test runs, pass rate, and execution progress.
Dashboard Metrics
- Total Projects: Number of test projects
- Active Test Runs: Currently running tests
- Pass Rate: Percentage of passed tests
- Execution Progress: Tests completed vs total
Export Formats
| Format | Best For |
|---|---|
| Stakeholder sharing | |
| Excel | Data analysis |
| HTML | Web viewing |
| JSON | API consumption |
Scheduling Reports
Set up automated reports:
- Go to Reports > Schedule
- Select report type
- Set frequency (daily/weekly)
- Add recipients
- Enable schedule
Custom Reports
Build custom reports:
- Go to Reports > Custom
- Select data sources
- Choose metrics
- Configure filters
- Generate
Report Sections
Project Overview
- Project name and description
- Test run summary
- Timeline and milestones
- Team members involved
Test Results Summary
- Total tests by status
- Pass rate calculation
- Blocked tests analysis
- Skipped tests explanation
Defect Analysis
- Total defects found
- Defects by severity
- Defects by component
- Resolution status
Trend Analysis
- Pass rate over time
- Defect discovery rate
- Execution velocity
- Quality improvement metrics
Recommendations
- Areas needing attention
- Process improvements
- Resource allocation suggestions
Next Steps
- Dashboard - Monitor real-time metrics
- Test Runs - Manage test campaigns
- Best Practices - Optimize testing process
