TestPilot Dashboard
The dashboard is the module's landing page.
Opening /testpilot takes you straight here.
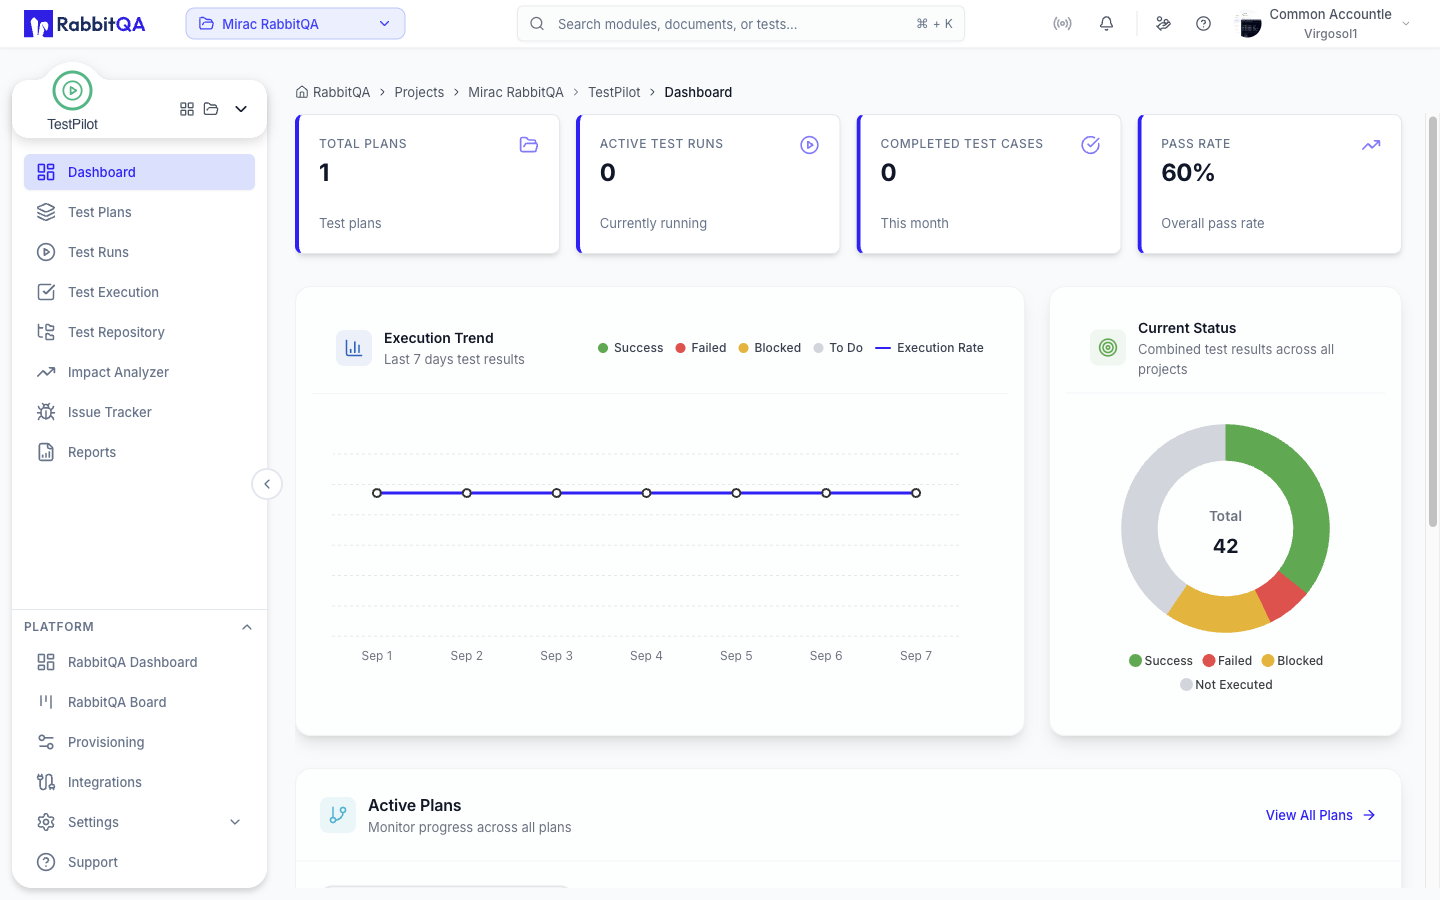
Metric cards
Four cards sit across the top of the page.
| Card | Value | Subtitle |
|---|---|---|
| Total Plans | Number of test plans in the workspace | Test plans |
| Active Test Runs | Runs currently inside their start and end dates | Currently running |
| Completed Test Cases | Tests completed in the current month | This month |
| Pass Rate | Share of executions that passed | Overall pass rate |
Each card carries a tooltip explaining how the number is derived.
Charts
Execution Trend
A stacked bar chart of the last seven days, with an execution-rate line on a secondary axis.
The bars group the execution statuses into four series:
| Series | Statuses included |
|---|---|
| Success | Passed, Bug Fixed |
| Failed | Failed |
| Blocked | Blocked, N/A |
| To Do | Retest, Running, Skipped, Untested |
Click a legend entry to hide or show that series. Hovering a day opens a tooltip that breaks the day down by individual status.
The window is fixed at seven days.
Current Status
A donut chart of combined results across all plans, split into Success, Failed, Blocked, and Not Executed, with the total in the center. Hovering the card opens a panel that expands those four groups into the individual statuses with counts and percentages.
Active Plans
A grid of plan cards showing, for each plan:
- Plan name
- Number of test runs and total tests
- Relative last-activity time
- A health pill: Healthy, Warning, or Critical
- A progress bar with completion percentage
Click a card to open that plan's runs at /testpilot/test-runs?planId=<id>.
View All Plans opens Test Plans.
If you have no plans yet, the card area shows a welcome message and a Create Plan button, which appears only if you hold testpilot:testset:create.
Recent Test Run Activity
A scrollable list of the latest runs. Each entry shows the run name, its type badge (Regression, Smoke, Manual, or Automation), the name of its latest test result, and counters for Total, Success, Failed, Blocked, and To Do, followed by a segmented progress bar and the last-run time with the person who ran it.
Click an entry to open its executions. View All Activity opens Test Runs.
Guided tour
First-time users get a five-step walkthrough that highlights the metric cards, both charts, Active Plans, and Recent Activity. The tour starts on its own after the sidebar tour finishes; it is not re-launchable from the dashboard.
Refreshing
The dashboard refreshes when you return to the browser tab or when the connection is restored. There is no timed auto-refresh and no manual refresh button, so reload the page if you need the very latest numbers mid-session.
Next steps
- Test Plans - organize runs into plans
- Test Runs - configure and monitor a campaign
- Reports - detailed per-run reporting
