Dashboard
The dashboard is the module's landing page.
Opening /smart-pbi takes you straight to /smart-pbi/dashboard.
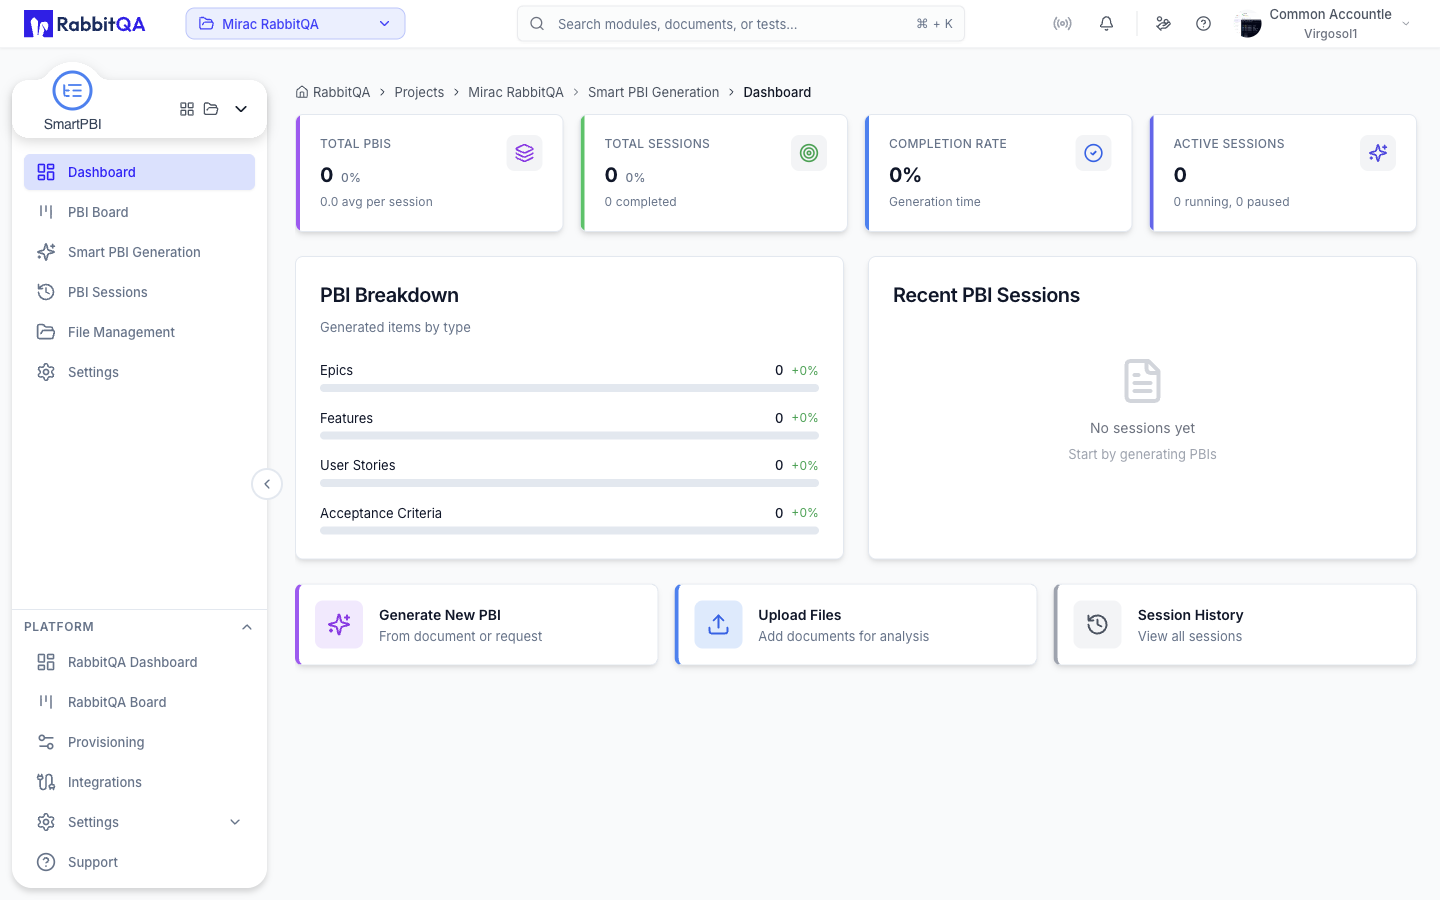
KPI cards
Four cards sit across the top.
| Card | Value | Subtitle |
|---|---|---|
| Total PBIs | Backlog items generated | Average items per session |
| Total Sessions | Generation sessions created | How many completed |
| Completion Rate | Share of sessions that completed | Average generation time in seconds |
| Active Sessions | Sessions currently active | How many are running and how many paused |
Total PBIs and Total Sessions show a trend against the previous period: green with an up arrow for an increase, red with a down arrow for a decrease. Completion Rate and Active Sessions carry no trend.
PBI Breakdown
A Generated items by type card lists the four output levels with their totals and week-over-week change.
| Row | Bar shows |
|---|---|
| Epics | This type's share of all generated items |
| Features | This type's share of all generated items |
| User Stories | This type's share of all generated items |
| Acceptance Criteria | The week-over-week change, not a share |
The counts and the percentage figures are reliable for all four rows.
The Acceptance Criteria bar does not work like the three above it. It is driven by the week-over-week change rather than the type's share, through a control that only accepts 0 to 100. A negative change or a missing value therefore renders an empty bar, and any change above 100% renders a full one. Read the count and the percentage next to the label rather than the bar.
Recent PBI Sessions
The card beside the breakdown lists the four most recent sessions with their item count, relative age, and status badge. Clicking one opens that session's detail page.
With no sessions yet, the card shows No sessions yet and a prompt to start generating.
Quick actions
Three cards along the bottom jump to the parts of the module you use most.
| Card | Goes to |
|---|---|
| Generate New PBI | Smart PBI Generation |
| Upload Files | File Management |
| Session History | PBI Sessions |
Generate New PBI is hidden entirely for users who cannot start a generation, because the page it opens is closed to them anyway.
Live data
The KPI cards, breakdown, and session list refresh on their own every few seconds, so a running generation updates the page without a reload.
