Dashboard
Overview of your document analysis and PBI generation processes.
What is the Dashboard?
The Analyzer Dashboard is the central control panel that enables you to monitor all analysis activities from a single screen. It provides real-time information about document quality scores, PBI generation statistics, and system performance.
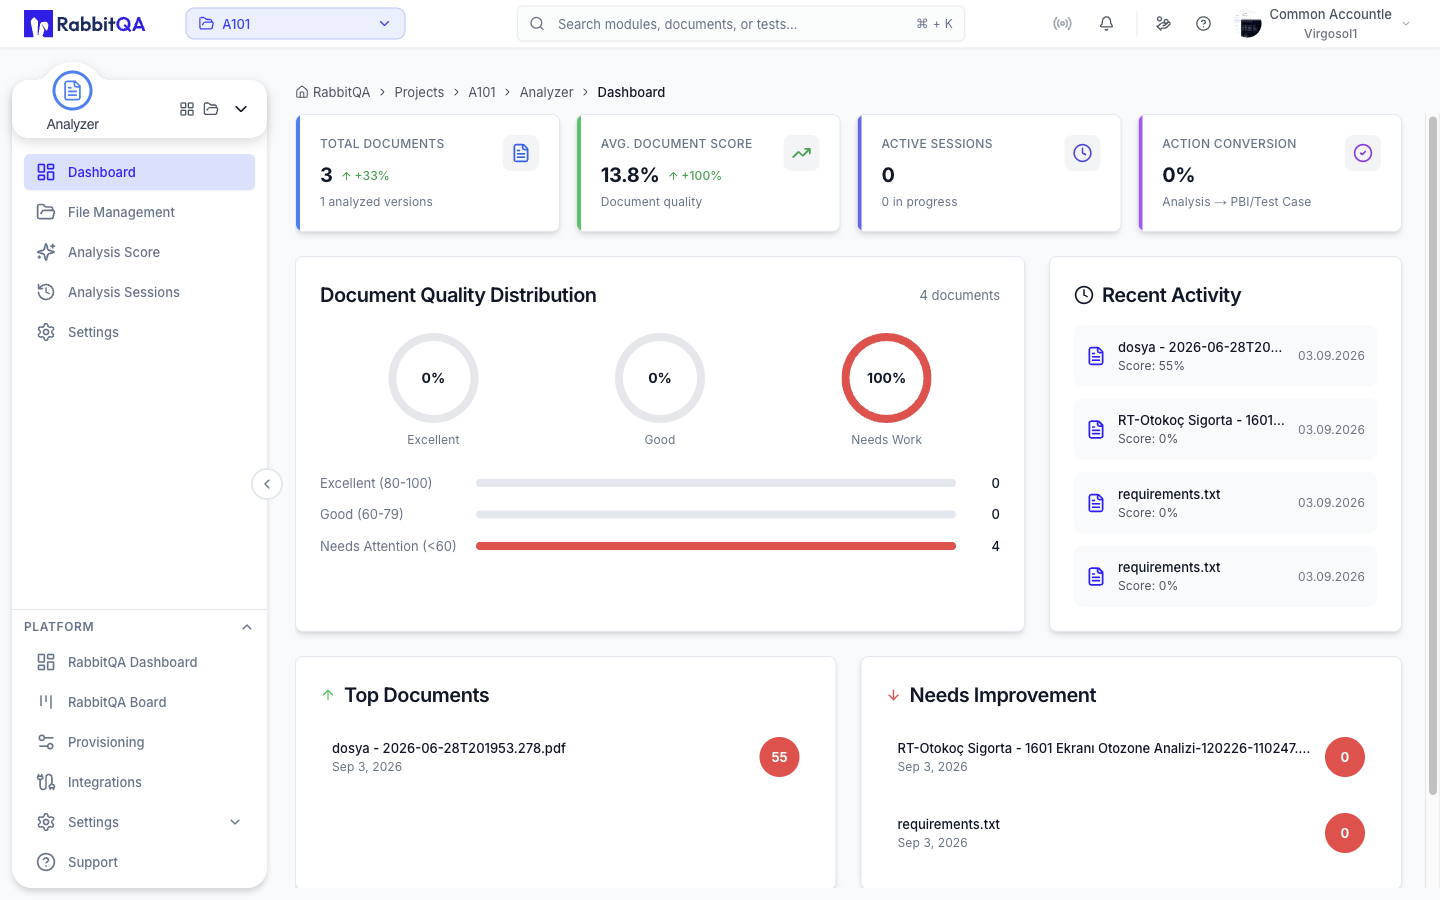
Metric Cards
The dashboard offers customizable KPI cards that visualize important metrics including total files, average score, generated PBIs, completed exports, active sessions, and connected integrations.
Use the "Customize KPIs" button to select your preferred metrics from up to 14 different KPIs. Your selections are automatically saved.
Trend Indicators
Each metric card shows change compared to previous period with green up arrow for increase, red down arrow for decrease, and percentage change rate.
Quality Overview
Chart visualizing document quality distribution: Excellent (80-100), Good (60-79), and Needs Attention (below 60). Click segments to filter, export as image, or download data.
Top/Bottom Documents
Shows highest and lowest scored documents with file name, score value, uploader name, upload date, and quick actions (View, Re-analyze, Delete).
Use this to identify best practices and find documents needing improvement.
Recent Activity
Lists last 5 analysis activities in chronological order including activity type (analysis, export, etc.), document name, score information, timestamp, and user avatar.
Monitor team work and track all analysis activities.
