Dashboard
The landing page for MobileHub at /devicer/dashboard.
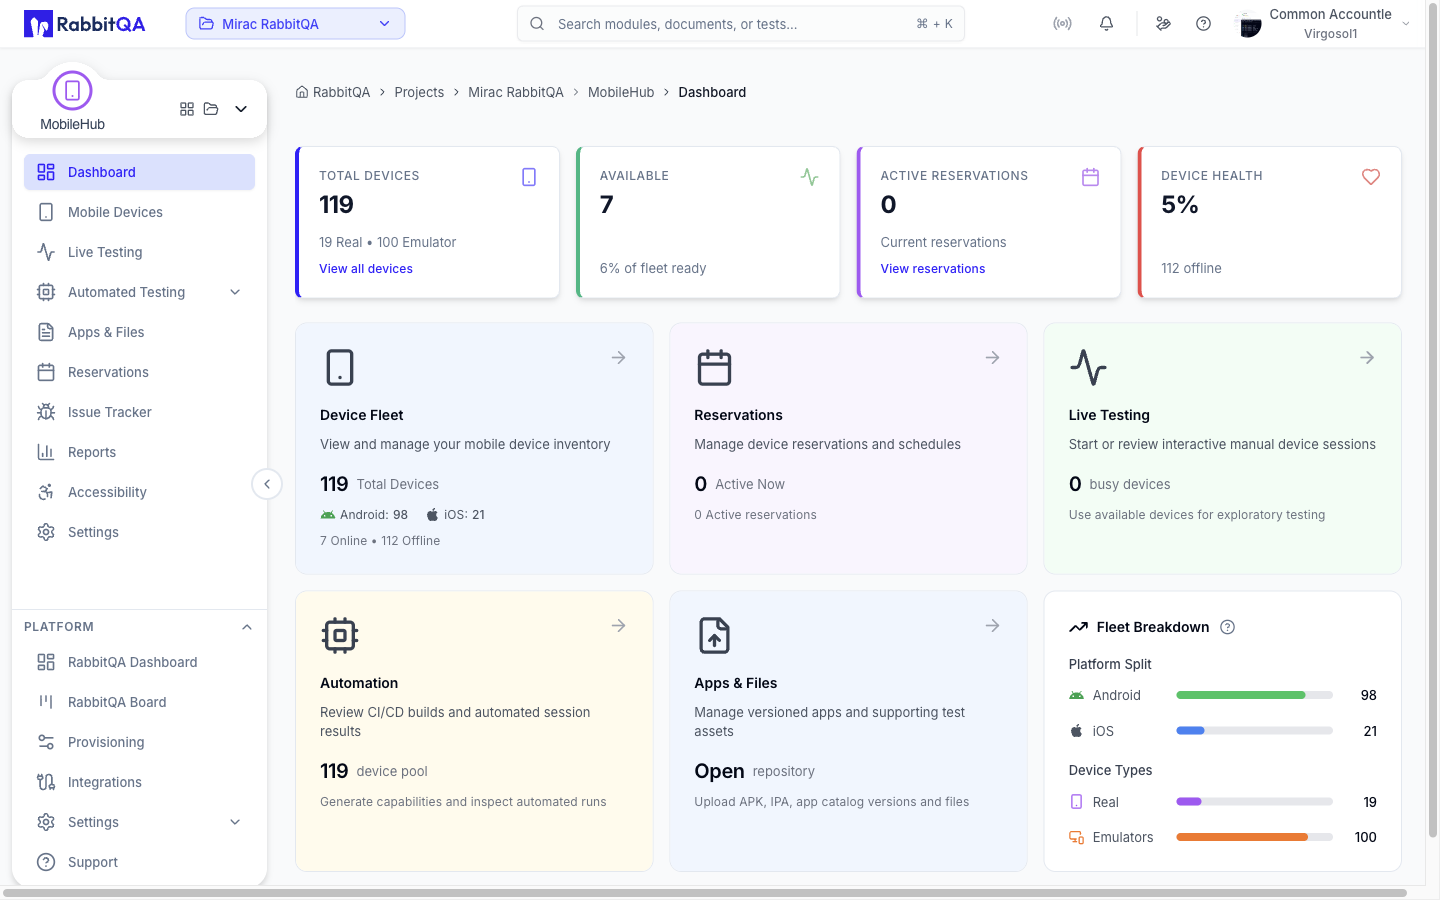
Metric Cards
Four cards summarize the fleet at the top of the page.
| Card | Shows |
|---|---|
| Total Devices | Total device count, with a real device and emulator split beneath |
| Available | Devices currently available for testing |
| Active Reservations | Reservations that are active right now |
| Device Health | Fleet health, with the number of offline devices beneath |
Quick Access Cards
Each card links to a section of the module and carries a headline figure.
| Card | Links to |
|---|---|
| Device Fleet | /devicer/devices |
| Reservations | /devicer/reservations |
| Live Testing | /devicer/live-testing |
| Automation | /devicer/automated-testing/builds |
| Apps & Files | /devicer/files |
Fleet Breakdown
Two proportional bars describe the composition of the fleet.
- Platform — Android against iOS.
- Device type — real devices against emulators and simulators.
Recent Activity
A feed of recent fleet events. Selecting an entry navigates to the related record.
| Event | Opens |
|---|---|
| Session started | The session detail page |
| Session ended | The session detail page |
| Device added | The Devices page with that device highlighted |
| Device offline | The Devices page with that device highlighted |
| File uploaded | Apps & Files |
| Reservation created | Reservations |
Most Used Devices
The five most used devices, ranked, with the device name and its usage figure. Selecting a row opens that device on the Devices page.
Quota Usage
The quota widget shows current consumption against the plan.
| Item | Shows |
|---|---|
| Storage | Storage used against the storage limit, as a percentage |
| Tests | Active sessions against the maximum concurrent sessions |
Beneath those, the widget lists the plan limits that apply to new work: live test duration, automation duration, and daily reservations. Select the widget to open the full breakdown on the Settings page under Quotas & Limits.
All quota values come from the plan attached to your company. There are no fixed numbers in the product itself.
