Audit Reports
Accessibility › Reports (/accessibility/reports) lists every audit in the workspace, across all plans, in one place.
Use it to see the overall state of accessibility work without opening each plan.
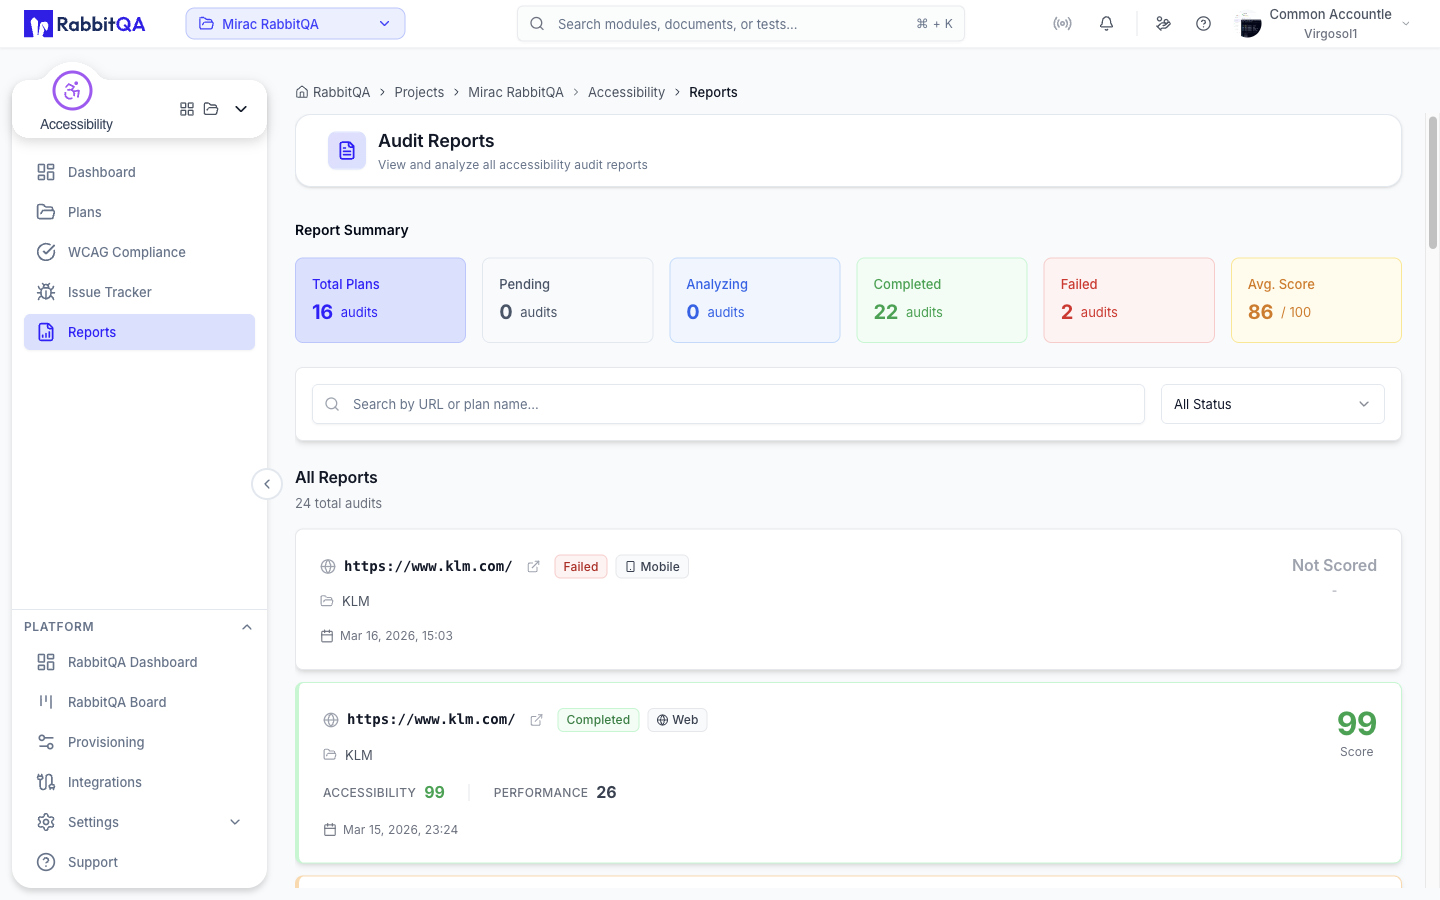
Report Summary
Six counters sit at the top of the page.
| Counter | Shows |
|---|---|
| Total Plans | Number of plans covered by the summary. |
| Pending | Audits queued for analysis. |
| Analyzing | Audits currently running. |
| Completed | Audits with results. |
| Failed | Audits whose analysis did not complete. |
| Avg. Score | Average accessibility score out of 100. |
Filtering
Two filters narrow the list.
| Filter | Options |
|---|---|
| Search | Free text matched against the audit URL or the plan name. |
| Status | All Status, Pending, Analyzing, Success, or Failed. |
Active filters appear as chips under the toolbar with a result count, and Clear filters removes them all.
Both filters run over the page of audits currently loaded rather than over the whole list, so the pagination controls are hidden while either one is active.
Report cards
Each audit is shown as a card.
| Element | Shows |
|---|---|
| URL | The audited page, with a shortcut to open it in a new tab. |
| Status | Not Analyzed, Pending, Analyzing, Completed, or Failed. |
| Device | Web, Mobile, or Desktop. |
| Plan | The plan the audit belongs to. |
| Scores | The accessibility and performance scores, for completed audits. |
| Date | When the audit was created. |
The large number on the right is the accessibility score, colored by band. An audit that has not completed shows Not Scored.
Selecting a card opens the full audit report, with the findings, screenshots, AI fix suggestions, and issue creation.
Pagination
The list is paginated, with a page size of 10, 20, 50, or 100.
Historical results
This page lists audits, not individual runs.
To compare a page over time, open the audit and use its run history, or open the group's batch run history. Both are described in Audits.
