Incidents
View, search, and investigate downtime events across all your monitors from a single incident management interface.
What are Incidents?
An incident is created automatically when a monitor records consecutive failures that exceed the configured failure threshold. The incident tracks the full lifecycle of the outage — from initial detection through to recovery — including timestamps, affected monitors, failure reasons, and response time impact.
Incidents Page
The Incidents page displays a paginated table of all recorded incidents, sorted by most recent first.
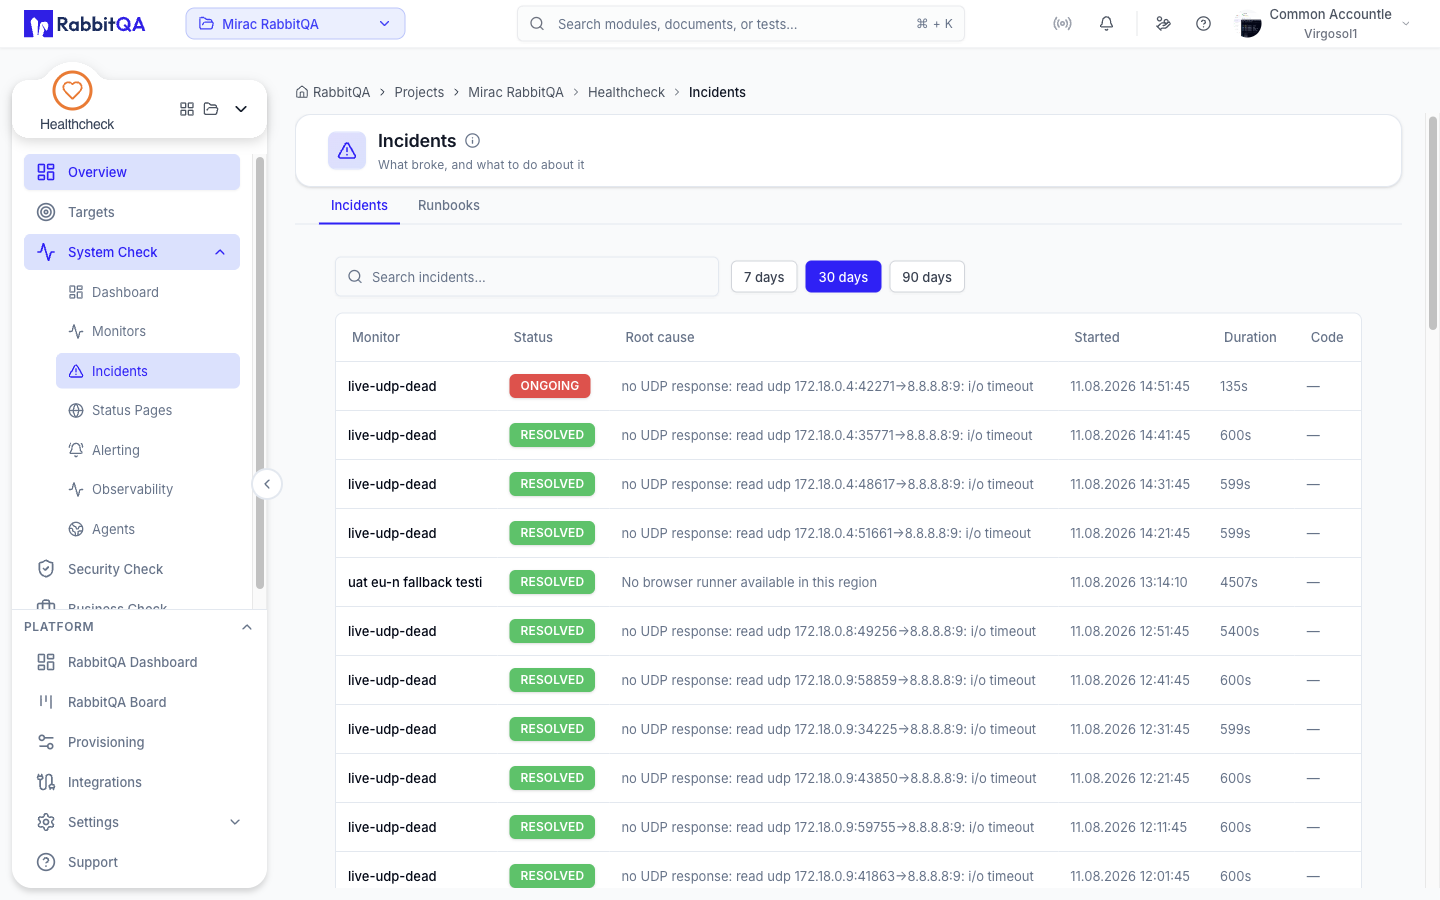
Incident Table Columns
| Column | Description |
|---|---|
| Monitor | Name of the monitor that triggered the incident |
| Status | Active (ongoing) or Resolved |
| Started | Timestamp when the first failure was detected |
| Duration | Total time from detection to recovery (or ongoing) |
| Type | Monitor type (HTTP, DNS, SSL, TCP, Ping, API, Synthetic) |
| Cause | Brief description of the failure reason |
Filtering Incidents
Use the filter controls above the table to narrow the incident list.
Search
Enter keywords to search across monitor names, failure reasons, and incident descriptions. The search updates the table in real time as you type.
Day Range
Select a predefined time window to filter incidents by occurrence date:
| Option | Shows Incidents From |
|---|---|
| Last 7 Days | Past week |
| Last 14 Days | Past two weeks |
| Last 30 Days | Past month |
Status Filter
Toggle between All, Active, and Resolved to focus on ongoing or historical incidents.
Use the 7-day filter during on-call rotations to review recent incidents quickly. Switch to 30 days for monthly reliability reviews.
Incident Detail View
Click any row in the incidents table to open the full incident detail page.
Incident Summary
The summary card at the top provides key facts at a glance:
- Monitor Name and target URL
- Current Status — Active or Resolved
- Started At — Exact timestamp of the first failure
- Resolved At — Timestamp of recovery (if resolved)
- Total Duration — Time from start to resolution
- Failure Reason — The specific error that triggered the incident
Incident Timeline
The timeline displays every check result during the incident in chronological order:
- Incident Opened — First consecutive failure detected.
- Check Failed — Each subsequent failed check is logged with timestamp, status code, response time, and error details.
- Alert Sent — Records when notifications were dispatched and through which channels.
- Escalation Triggered — If escalation policies activated, the timeline shows each level.
- Check Recovered — The first successful check after the failure sequence.
- Incident Resolved — Marked resolved after the recovery threshold is met.
Each timeline entry is color-coded: red for failures, yellow for alerts, and green for recovery.
Response Time Impact
A line chart shows response times during the incident period compared to the monitor's baseline average. This highlights how significantly the outage impacted performance before full failure.
Affected Checks
A detailed log of every individual check during the incident window, including:
- Timestamp
- HTTP status code (or protocol-specific result)
- Response time
- Error message or timeout indicator
Root Cause Analysis
HealthCheck provides contextual information to help identify the root cause of an incident:
- Error Pattern — Groups repeated failure reasons to identify the dominant cause (e.g., connection timeout, DNS resolution failure, SSL handshake error).
- Response Code Distribution — Shows which HTTP status codes were returned during the incident (4xx client errors vs. 5xx server errors).
- Latency Spike Detection — Flags whether response times were degrading before the outage, indicating a gradual failure versus a sudden crash.
- Correlated Incidents — Lists other monitors that experienced incidents during the same time window, suggesting a shared infrastructure issue.
Correlated incidents are identified by overlapping time windows. If multiple monitors fail simultaneously, investigate shared dependencies such as load balancers, DNS providers, or cloud region availability.
Next Steps
- Review monitor reports for detailed uptime and performance data.
- Adjust alert rules if incidents are being triggered too aggressively or too slowly.
- Schedule exclusion windows for planned maintenance to avoid false incidents.
